
Figure 2.
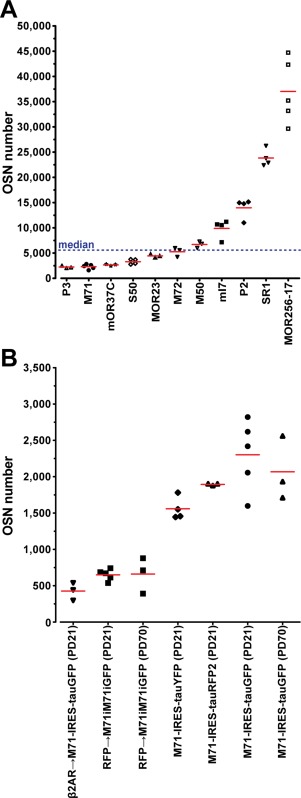
Numbers of fluorescent cells in OR‐IRES‐marker strains. (A) Average OSN number of the core set of 11 gene‐targeted strains at PD21. A symbol represents a single mouse. The blue line indicates the median of 5,983. (B) Average OSN number for strains with gene‐targeted mutations in the M71 locus at PD21 or PD70. The five mice of M71‐IRES‐tauGFP at PD21 in (B) are the same as in (A).