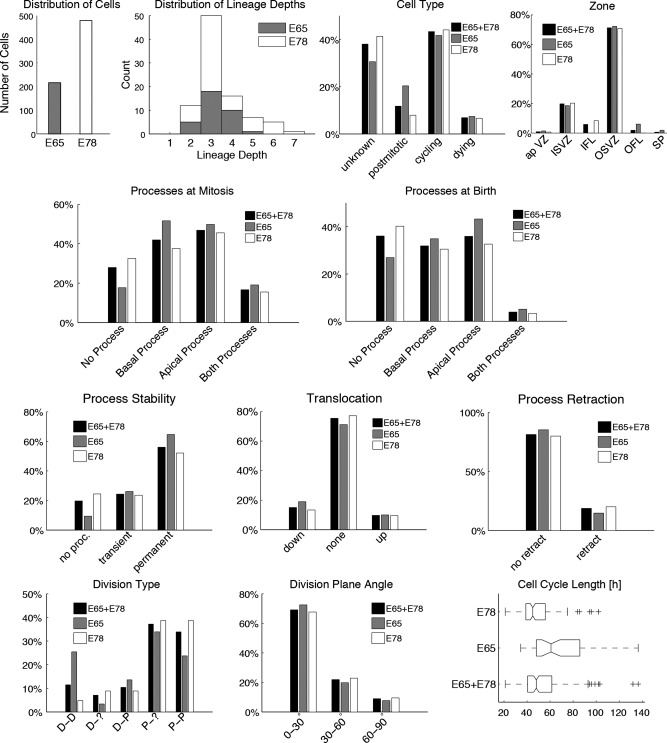
Figure 3.

Analysis of the global statistics of the dataset at E65 (31% of all cells, gray bars) and E78 (69%, white bars), as well as for the combined dataset (E65+E78, black bars). The first two diagrams show for both developmental stages the counts of cells and the distribution of lineage depths, respectively. The following histograms show for each developmental stage and the combined dataset the distribution of the discrete parameter values for each feature, as described in Table 2. For cell cycle lengths the boxplots indicate the continuous feature distribution at each stage.
