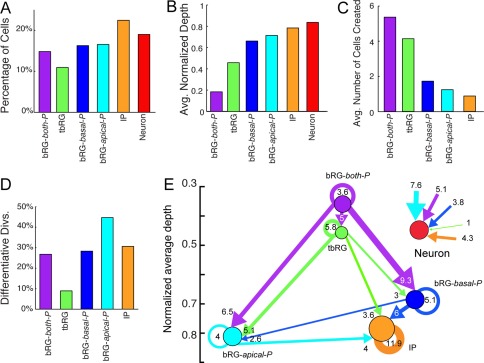
Figure 9.

Analysis of the lineage properties of automatically extracted precursor types, obtained by the HMT algorithm using K = 6 types and imposed directionality of possible transitions. A: Distribution of cell types: imposing directionality leads to a shift of cell type proportions. B: Average normalized depth of cells of each type. C: Average number of cells in the progeny. D: Percentage of differentiative divisions per cell type. E: Transition diagram between precursor types. All allowed transitions except for direct bRG‐both‐P to IP transitions are observed, but proportions are very different from previous results in Fig. 5 and Fig. 7, as well as for manual classification (Betizeau et al., 2013). The constrained transition diagram cannot capture the observed bidirectionality of transitions.
