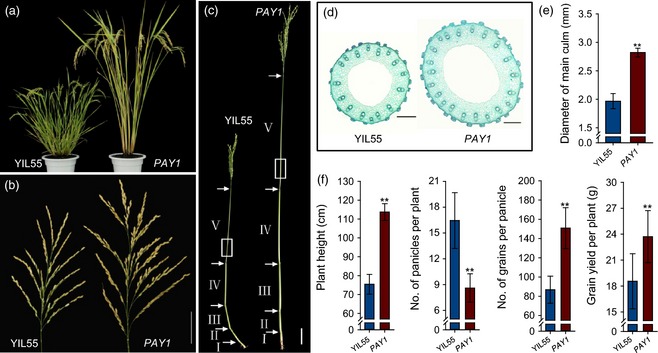
Figure 1.

Phenotype of wild‐type (YIL55) and PAY1 mutant. (a) Introgression line YIL55 and the PAY1 mutant at maturity stage. (b) Main panicle of YIL55 and PAY1 mutant. Scale bar, 5 cm. (c) Stem structure of YIL55 and PAY1 mutant. The interval between two arrows showed the length of internode. (d) Longitudinal sections of the fifth internode (marked by white squares in (c)) between YIL55 and PAY1 mutant. Scale bars, 200 μm. (e) The diameter of the fifth internode between YIL55 and PAY1 mutant. Data are means ± standard deviation (SD) (n = 20). (f) Comparison of plant height, number of panicles per plant, grain number per panicle and grain yield per plant between YIL55 and PAY1 mutant plants. Data are means ± SD (n = 30). In (e) and (f), the double asterisks represent a significant difference determined by Student's t‐test at P < 0.01.
