Figure 5.

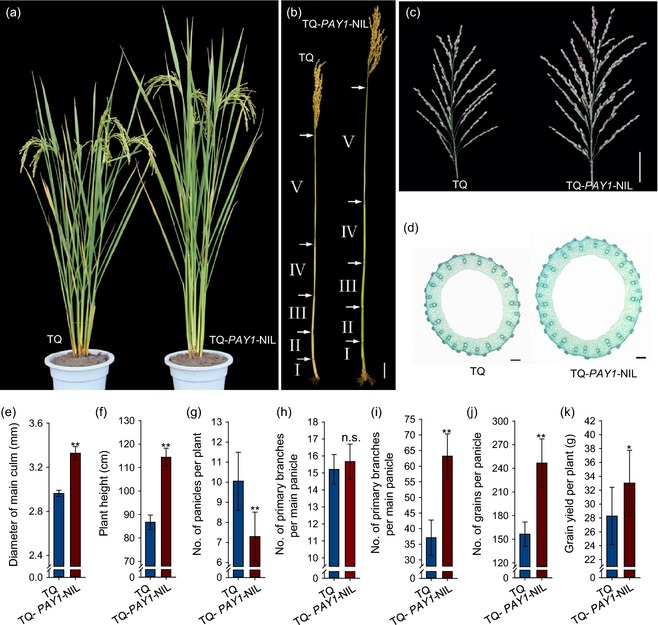
Phenotype of Teqing (TQ) and TQ‐PAY1‐ NIL plants. (a) Gross morphologies of TQ and TQ‐PAY1‐ NIL plants at the maturity stage. (b) Stem structure of TQ (left) and TQ‐PAY1‐ NIL (right) plants. The interval between two arrows showed the length of internode. (c) Comparison of the main panicle between TQ and TQ‐PAY1‐ NIL plants. Scale bar, 5 cm. (d) Cross‐sections of the fifth internode between TQ and TQ‐PAY1‐ NIL plants. Scale bars, 200 μm. (e) The diameter of the fifth internode between TQ and TQ‐PAY1‐ NIL plants. Data are means ± standard deviation (SD) (n = 20). (f–k) Comparison of plant height (f), number of panicles per plant (g), number of primary branches per main panicle (h), number of primary branches per main panicle (i), grain number per panicle (j) and grain yield per plant (k) between TQ and TQ‐PAY1‐NIL plants. Data are means ± SD (n = 30). **, Significant at 1% level; *, significant at 5% level; n.s., not significant.
