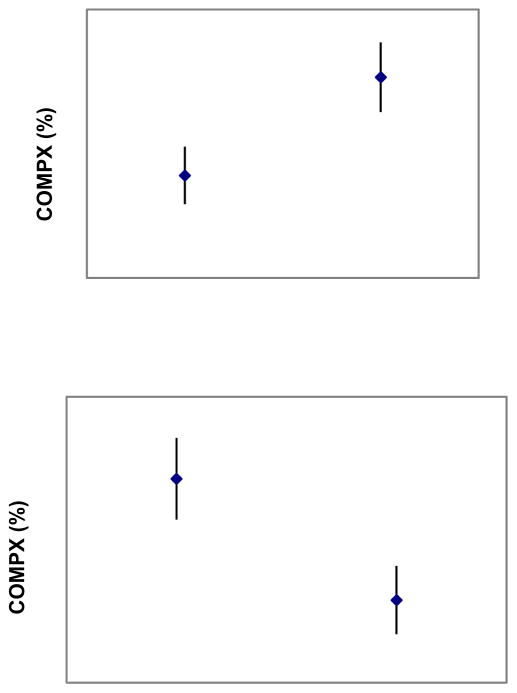
Figure 1.
Mean (±SD) COMPX% as a function of child sex (upper panel) and ethnicity (lower panel).
Note: For COMPX% scores, 100% represents perfect self-regulatory eating or compensatory eating. Progressively lower scores (<100%) represent undercompensation and progressively higher scores (>100%) represent overcompensation.

