
Figure 1. Epitope Paratope Connectivity Network of Putative Affinity-Enhancing Mutations and Structural Impact of Asn360Tyr Mutation (EDIII) on Antigen-Antibody Interaction.
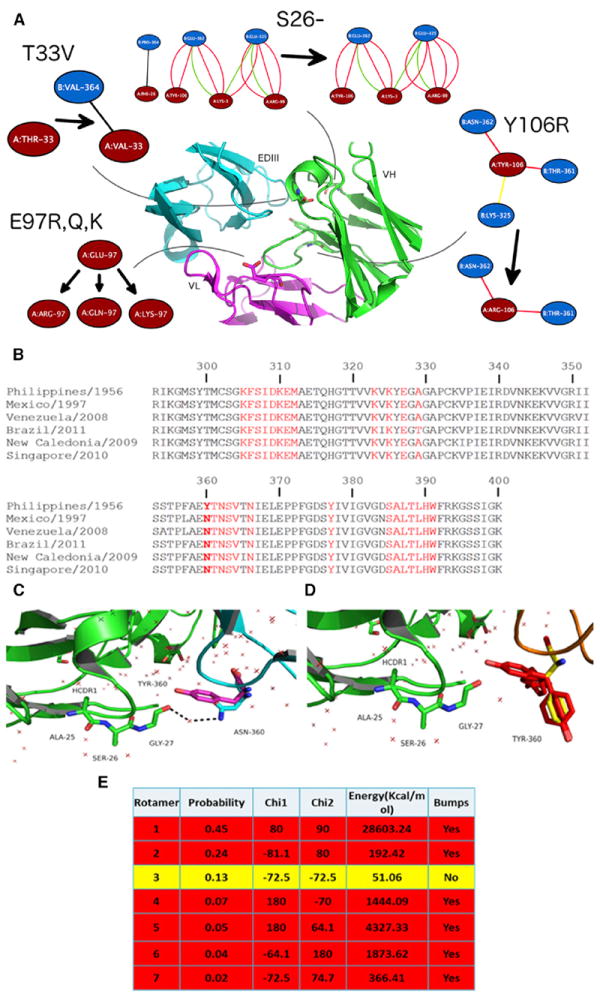
(A) The EPC networks observed in 4E11 and mutant antibodies are shown for examples of putative affinity enhancing positions. Each of these EPCs networks is shown as a 2D graph: nodes represent amino acids (antibody: red; antigen: blue) and edges represent inter-residue non-covalent interactions (black: hydrophobic bonds; red: hydrogen bonds; yellow: cation pi; green: ionic). For each position of interest, the EPC network is given before and after mutation (with the arrow pointing from the WT to the modeled structure).
(B) Sequence alignment of EDIII domain of representative DENV-4 strains from genotypes I, IIA, and IIB. 4E5A epitope residues are highlighted in red. The column corresponding to the Asn360Tyr mutation, observed in the genotype I strain H241 (Philippines/1956), is highlighted by bold letters.
(C) Close-up view of CDR-H1 and the DE-loop (residues 358–365) as observed in the 4E11-EDIII (DENV-4) co-crystal structure (PDB: 3UYP): VH: green; VL: not shown; EDIII: cyan. Asn360 forms a water-mediated hydrogen bond (dotted arrows) with Gly27 of the CDR-H1 loop of 4E11.
(D) Alternate conformers of Tyr360 generated by modeling are rendered in stick format. The side chains of these conformers are colored according to potential steric clashes: yellow-favorable; red-unfavorable.
(E) Energetic calculations as carried out using Discovery Studio.