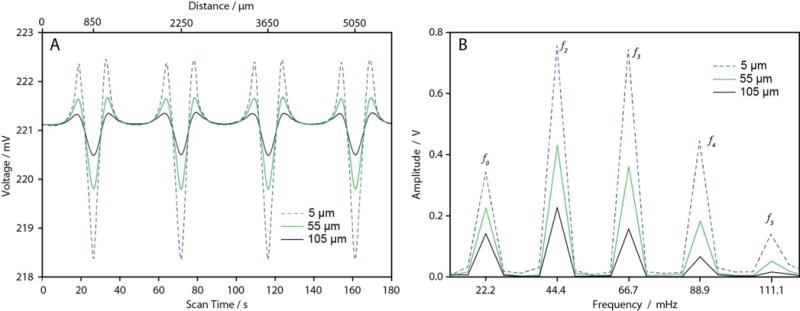
Figure 2.

(A) Voltage recorded from four nickel addresses during scans with the MR sensor at different separation distances (5 μm, blue; 55 μm, red; and 105 μm, black). As the separation distance decreases, the magnitude of the signal features increases due to an increased magnetic flux detected by the sensor. (B) Frequency spectrum of MR response contains a fundamental frequency (f0) at 22.2±0.1 mHz and four harmonics (f2 at 44.4±0.1 mHz, f3 at 66.7±0.1 mHz, f4 at 88.9±0.1 mHz, and f5 at 111.1±0.1 mHz).
