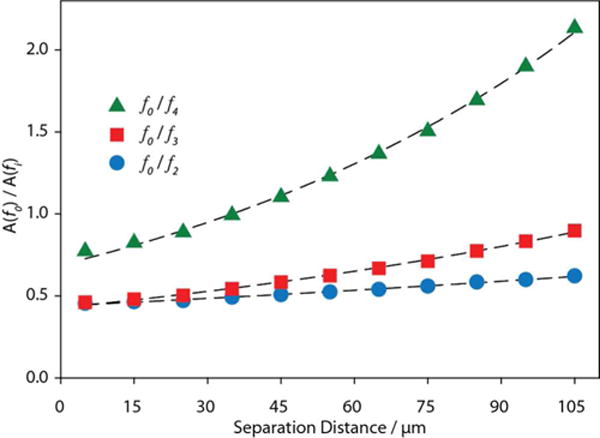
Figure 3.

Plot of the harmonic ratios as a function of separation distance. The amplitude (A) ratios of the fundamental frequency to the 2nd (circles), 3rd (squares), and 4th (triangles) harmonics are shown at each separation distance. The dashed lines represent the best fit lines, as determined through least squares fitting of the data to a two parameter exponential expression. Errors bars are smaller than the data points, and are a result of the 10 μV noise in the signal. The 5th harmonic was excluded due to the weakness of the signal at the larger separation distances.
