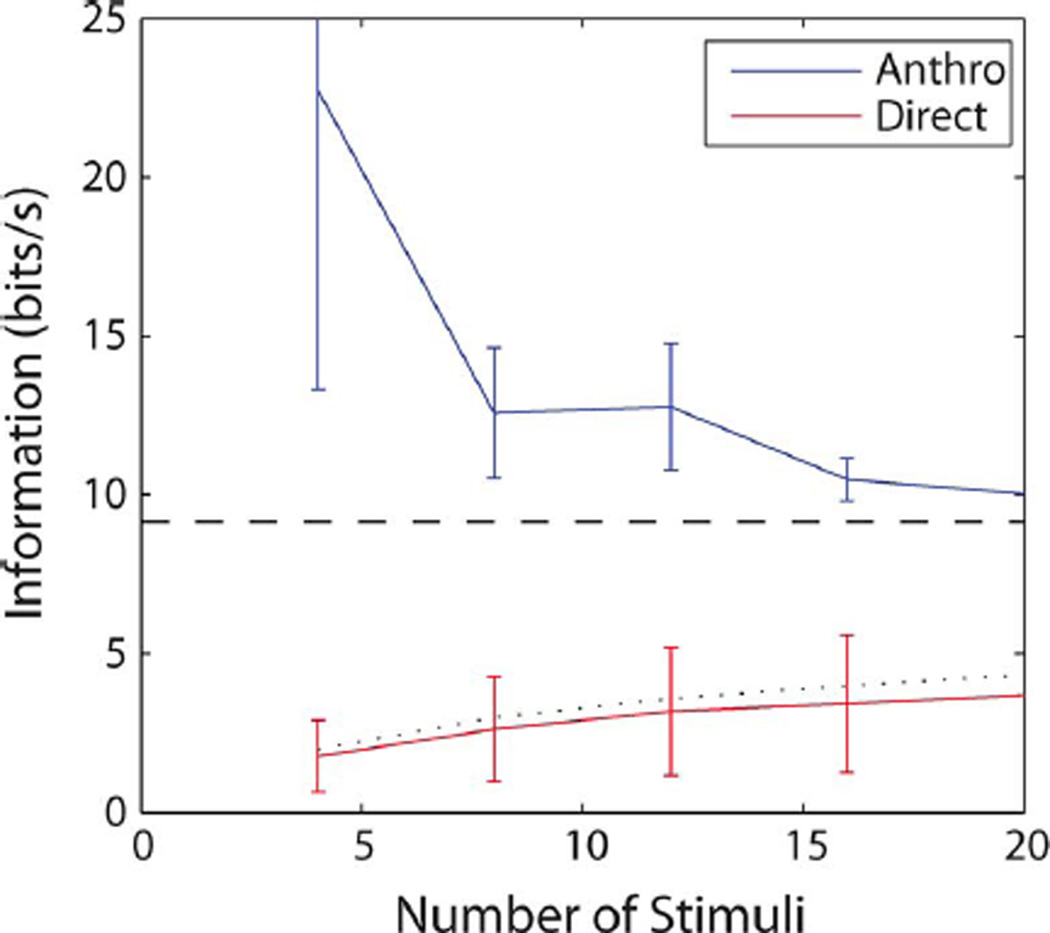
Fig. 4.
MI as a function of the number of stimuli obtained from the naive estimate (red) and from the anthropic correction. The dotted line shows the saturation bound of the naive estimate log2(K). The dashed line is the gamma information for this neuron. This example corresponds to one of the best neurons both in terms of gamma information and in terms of the goodness of fit of the decoding algorithm; note that the naive estimate is very close to its theoretical (saturation) upper bound.

