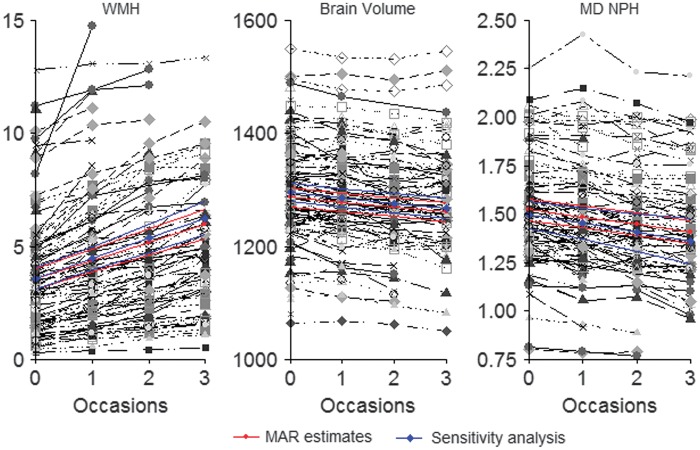
Figure 1.
Plots showing individual trajectories in magnetic resonance imaging (MRI) markers showing a decrease in mean diffusivity (MD) normalized peak height (MD NPH), a decrease in brain volume and an increase in white matter hyperintensity volume (WMH) over the 3-year follow-up period. Time points are shown on the x axis. The average slope is shown in red with credibility intervals. There is only a minimal change in slope when missing data are accounted for in simultaneous models (shown in blue). MAR, missing at random.

