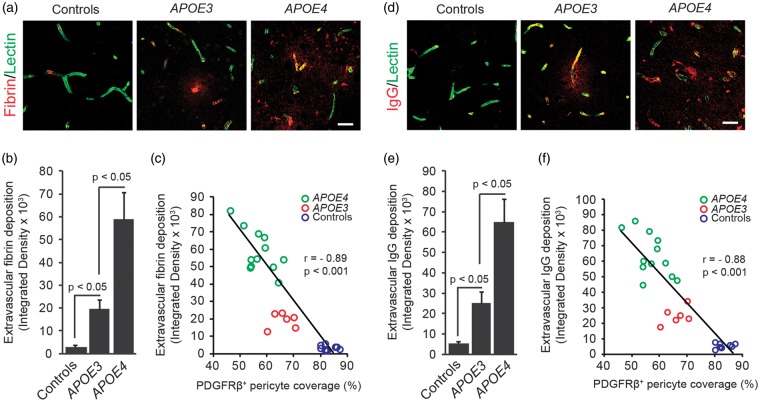
Figure 2.
Increased fibrin and immunoglobulin G (IgG) extravascular deposits in APOE4 carriers with Alzheimer’s disease correlates with pericyte degeneration. (A) Representative confocal microscopic analysis of fibrin extravascular deposits (red) and lectin-positive endothelial profiles (green) in the frontal cortex of an age-matched neurologically intact control (left), an AD APOE3/APOE3 patient (middle), and an AD APOE4/APOE3 patient (right). Scale bar, 25 µm. (B) Quantification of fibrin extravascular fibrin in the frontal cortex in neurologically intact controls, AD APOE3 group, and AD APOE4 group. (C) Negative correlation between fibrin extravascular deposits and PDGFRβ-positive pericyte coverage of brain capillaries in the frontal cortex of neurologically intact controls (blue), AD APOE3 patients (red), and AD APOE4 patients (green). Single data points are from all controls and AD patients (n = 27). (D) Representative confocal microscopic analysis of IgG extravascular deposits (red) and lectin-positive endothelial profiles (green) in the frontal cortex of an age-matched neurologically intact control (left), an AD APOE3/APOE3 patient (middle), and an AD APOE4/APOE3 patient (right). Scale bar, 25 µm. (E) Quantification of IgG extravascular deposits in the frontal cortex in neurologically intact controls, AD APOE3 group, and AD APOE4 group. (F) Negative correlation between IgG extravascular deposits and PDGFRβ-positive pericyte coverage of brain capillaries in the frontal cortex of neurologically intact controls (blue), AD APOE3 patients (red), and AD APOE4 patients (green). Single data points are from all controls and AD patients (n = 27). Mean±s.e.m., n = 9 for non-AD control; n = 6 for AD APOE3 group; and n = 12 for AD APOE4 group. r = Pearson’s coefficient. AD, Alzheimer’s disease; APOE, apolipoprotein E.

