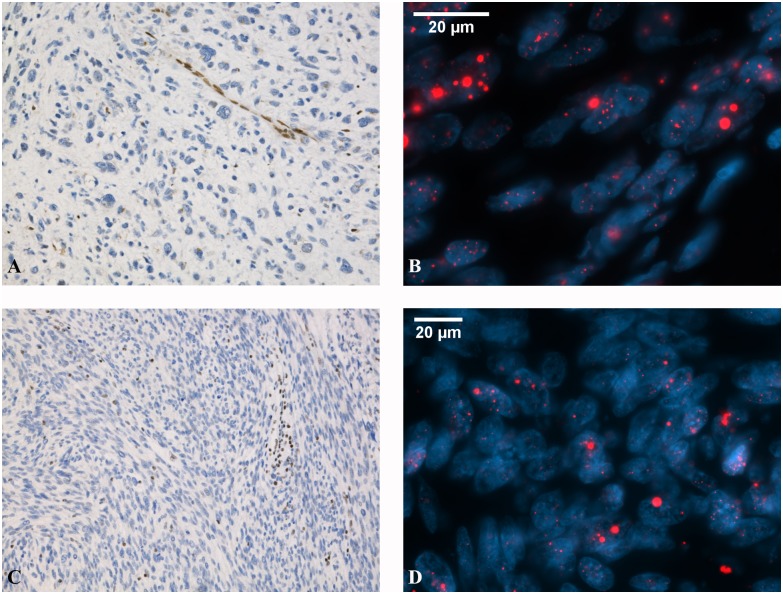
Fig 2. Representative images of ATRX and DAXX expression and ALT phenotype in ULMS.
ATRX-mutated ULMS showing loss of ATRX expression (A) and positive ALT phenotype (B). Large, abnormally bright telomere FISH signals (red) are indicative of ALT. DAXX-mutated ULMS with reduced DAXX expression (C) and positive ALT phenotype (D). Immunohistochemical stainings are shown with 10×20 magnification and FISH stainings with 10×63 magnification.

