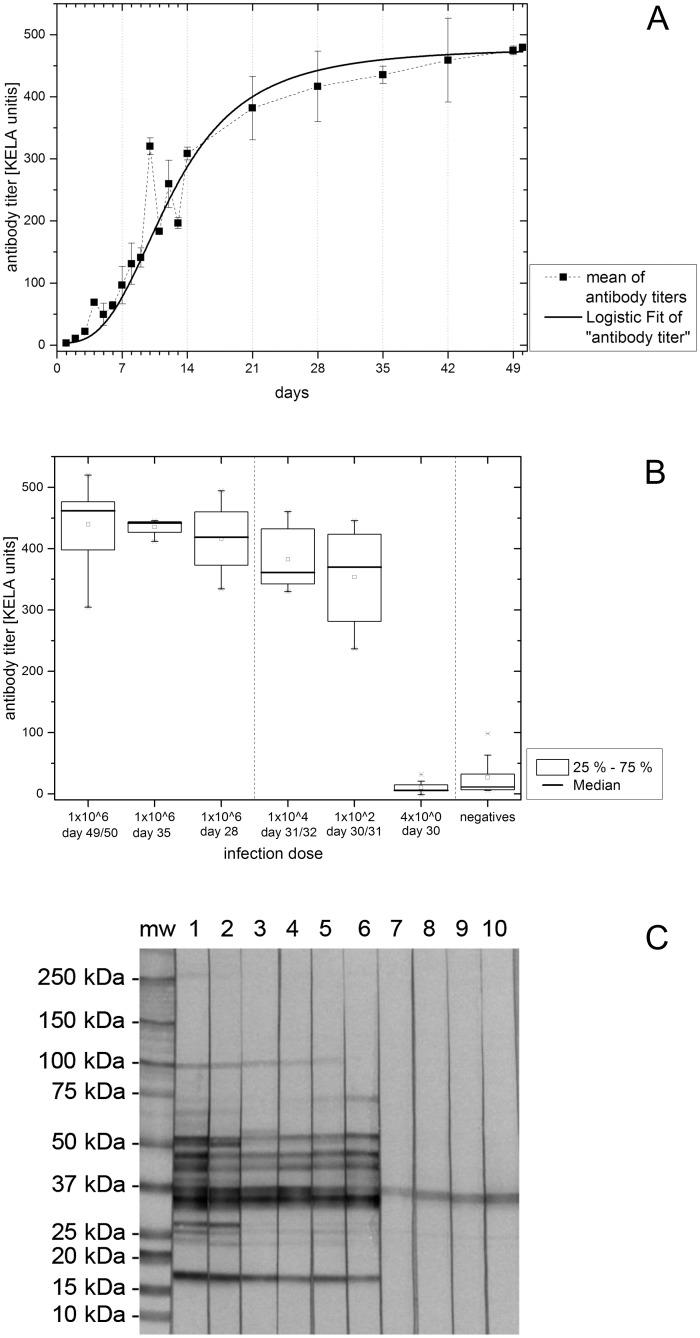
Fig 3. A-C. Antibody response against B. persica.
Fig 3A. Antibody levels of pooled plasma samples (infection dose 1 x 10⁶ B. persica/mouse). The mean (calculated out of the values of the subgroup-specific pooled plasma samples) and the standard deviation (Y-axis) are plotted against the blood sampling days (X-axis). The logistic fitting is shown as a continuous line. Fig 3B. Antibody levels of all experimental infection dose groups are shown as box plots; serum samples from final days and pooled plasma samples from days 35 and 28. Fig 3C. Western blot of final sera from two randomly selected mice out of each infection dose group. Mw = molecular weight standard; 1, 2 = 1 x 10⁶ B. persica/mouse; 3, 4 = 1 x 10⁴ B. persica/mouse; 5, 6 = 1 x 10² B. persica/mouse; 7, 8 = 4 x 100 B. persica/mouse; 9, 10 = negative mice.

