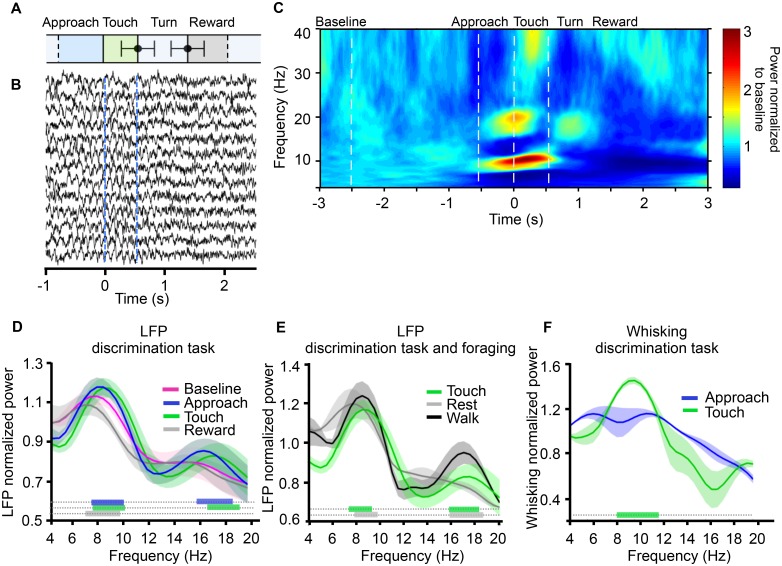
Fig 3. Hippocampal LFP during tactile discrimination task and foraging.
(A) Time course of texture discrimination: bar lengths represent the average duration of each episode in the task, as labeled above. Touch (green bar) started at the onset of first contact and ended at the offset of final contact. Turn (light grey) started at the offset of final contact and ended at the arrival at the reward spout. Black points with error bars represent the mean ± standard deviation (SD) of ending time of touch (540 ± 224 ms) and turn (798 ± 395 ms) episodes across sessions and rats. Data were aligned to onset of first contact so SD = 0 at the boundary between approach and touch. Approach (blue) and reward (dark grey) had fixed duration but variable onset and offset, respectively (see Materials and Methods for analysis criterion), so their onset and offset are marked by dashed lines. (B) Hippocampal LFP of 13 trials (randomly chosen from one session) aligned to touch onset (0 s). (C) Averaged power spectrogram relative to baseline (defined as interval between -3 and -2.5 s) aligned to first contact (touch onset). Data are from same session as B but now all correct trials are included. Start and end of approach and touch are marked with dashed lines. (D) Grand average (n = 4 rats, also illustrated in E and F) of LFP power spectrum associated with different task episodes. In each animal LFP power was normalized to baseline power: LFP power value (10*log10(power)) from each task episode was divided by 4 Hz baseline LFP power (10*log10(4 Hzbaseline)), and then averaged across animals. Shading is standard deviation (also in E and F). Color bars at the base of the figure indicate frequencies at which there was a significant power difference, versus baseline, during approach (blue), touch (green) and reward (grey) (randomization test, see Materials and Methods). (E) Grand average of LFP power spectrum during the discrimination task (touch episodes) and foraging (walk and rest episodes). Color bars indicate frequencies at which there was a significant power difference for the following comparisons: walk versus touch (green), and walk versus rest (grey). (F) Grand average of whisking power spectrum during the discrimination task (approach and touch episodes). Green bar indicates frequencies at which there was a significant power difference for approach versus touch, revealing the concentration at 8–12 Hz during touch. All data are available at http://figshare.com/s/99b31b8a567f11e5b81d06ec4bbcf141.

