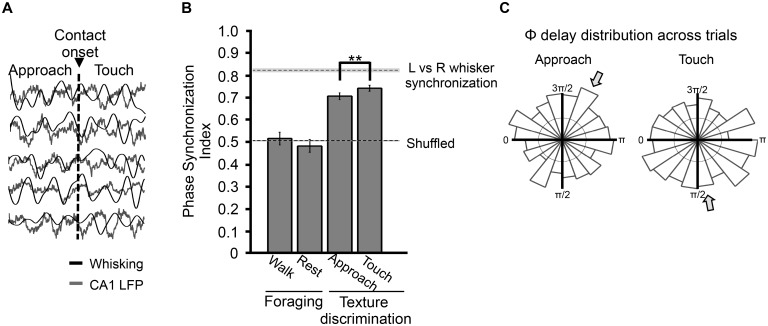
Fig 4. Whisking-theta synchronization during tactile discrimination task and foraging.
(A) Simultaneous traces of whisking oscillation and theta rhythm aligned to contact onset for five trials randomly chosen from one session. (B) Phase Synchronization Index (PSI) during walk and rest episodes while foraging (n = 2 rats, 163 and 175 trials, respectively), and during approach and touch episodes during the texture discrimination task (n = 4 rats, 915 trials). Values correspond to mean ± 95% confidence interval. Dashed lines represent lower and upper limit of PSI values; lower limit (PSI = 0.507) is the mean + 95% confidence interval PSI of random sets built by shuffling rats and conditions. Top dashed line corresponds to the upper limit for PSI based on the coherence between whisking of the left versus right sides of the snout (PSI = 0.82, n = 4 rats, 1052 trials). Conditions were compared by applying a two-sample randomization test, p < 0.0001; see Materials and Methods. (C) Polar plots of theta-whisking phase delay distribution during approach and touch, sampled from correct trials showing a significant degree of synchronization (trials exceeding 95% confident limit). The Rayleigh test was applied to test for phase delay preference across trials. During approach the test showed no significant clustering (Rayleigh test, p = 0.06), while during touch the mean phase delay became clustered across trials (Rayleigh test p = 0.04). The circle centered at the origin represents 20 trials. All data are available at http://figshare.com/s/99b31b8a567f11e5b81d06ec4bbcf141.

