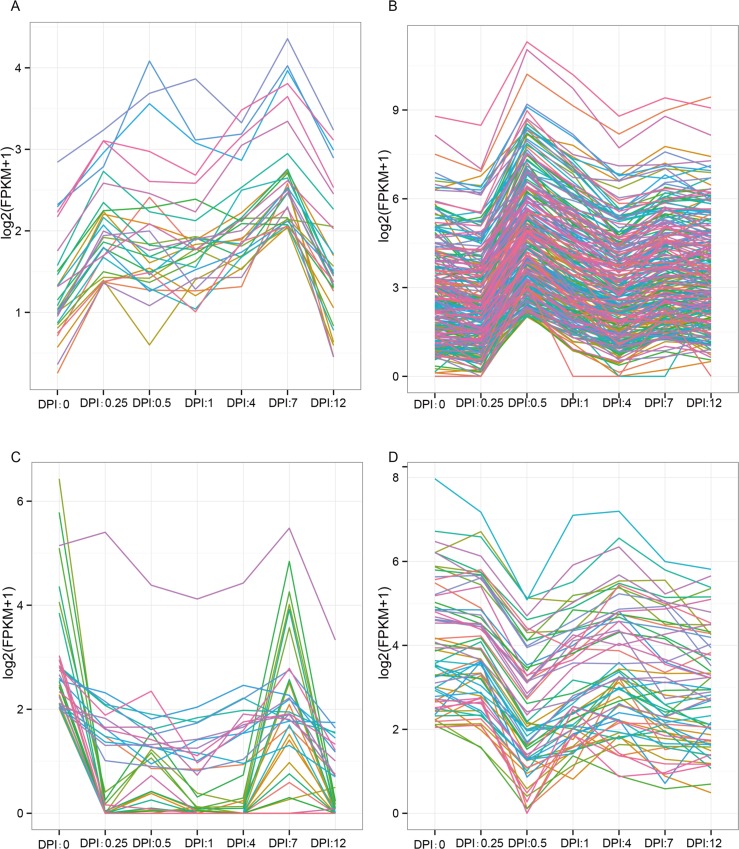
Fig 3. Most represented patterns of time-course data for DEGs.
Unigene expression profiles are clustered using the Short Time-series Expression Minor program. The y-axes represent expression level and the x-axes represent different stages after C. destructans infection. A) Expression increased at 0.25 DPI relative to the 0 DPI. In the middle stage, the expression of part genes decreased and then slightly increased at 7 DPI. B) The expression pattern of most of the unigenes rapidly increased at 0.5 DPI relative to the 0 and 0.25 DPI, and then decreased at 4 DPI. At 7 DPI there were slightly increased. C) The expression of part down-regulated unigenes decreased at 0.25 DPI and then remained at low level from 0.5 DPI to 4 DPI. At last two stages the unigenes sharply increased at 7 DPI and sharply decreased at 12 DPI. D) The expression of the down-regulated unigenes sharply decreased at 0.5 DPI relative to the 0 DPI, then other stage maintained relative stable expression.

