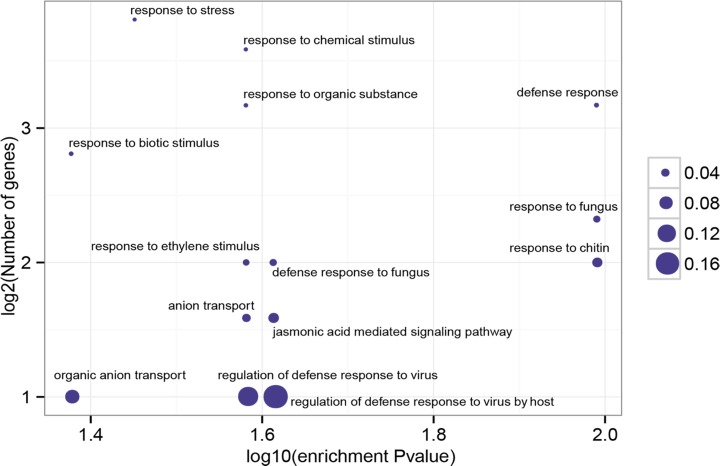
Fig 4. Significant enrichment functional groups of DEGs.
The most significant GO terms (P < 0.05) of differentially expressed unigenes are graphically presented by comparing with total transcripts. The x-axis represents log10 of the enrichment P value. The y-axis indicates the number of unigenes in log2 value. The size of each point is proportional to the percentage (DEG associated with GO terms/All unigenes associated with GO terms).

