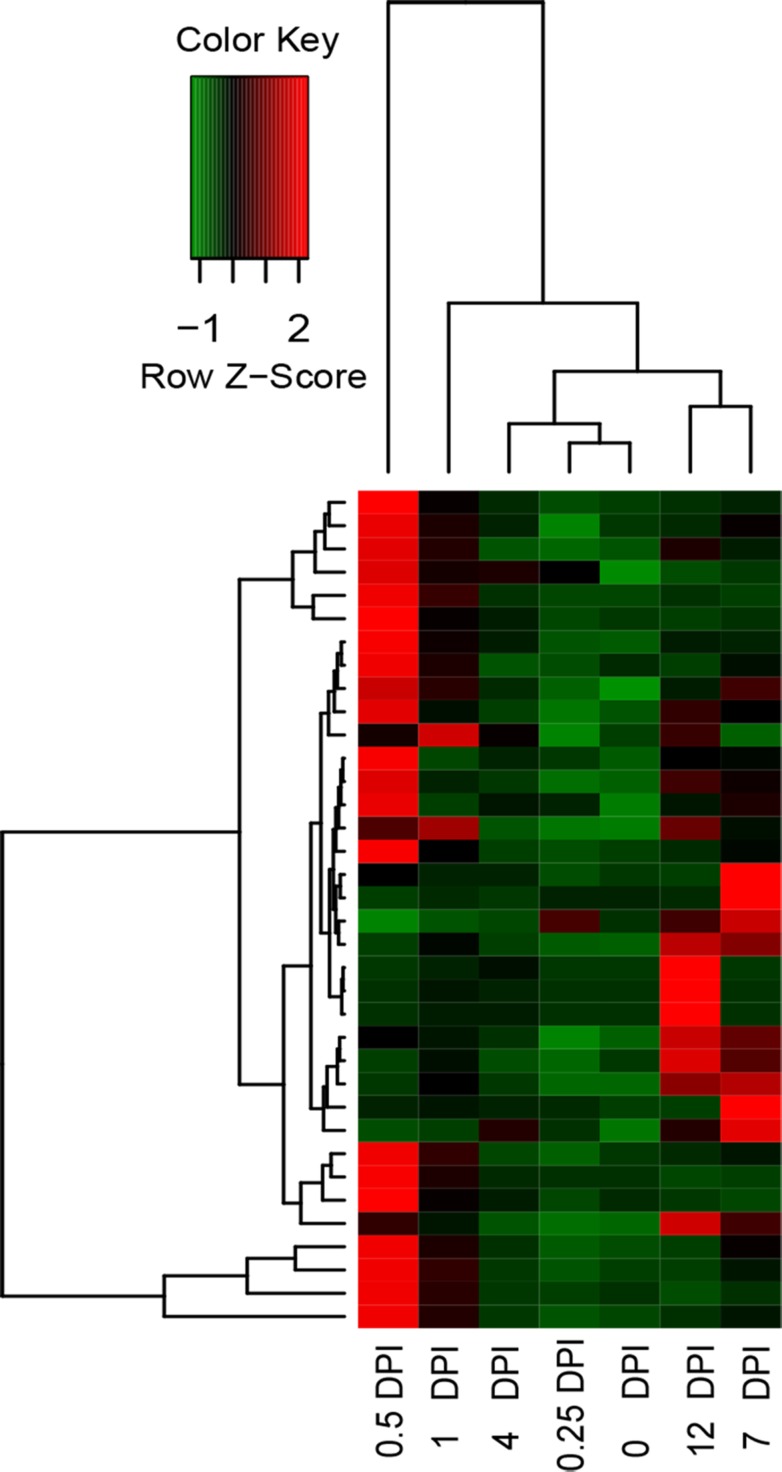
Fig 7. Heatmap showing the FPKM values of up-regulated RGs.
The FPKM for the RGs in the control and six infected stages was used for hierarchical analysis. The heatmap shows the expression abundance of the RGs. The colors correspond to the value of FPKM, ranging from green (low expression) to red (high expression).

