Figure 1.

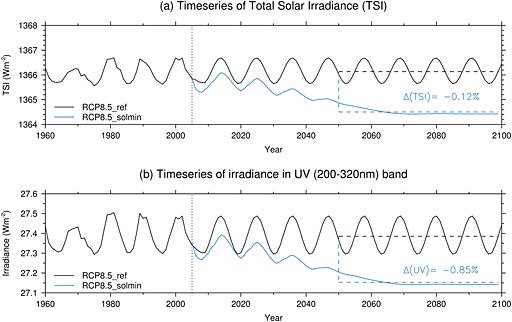
Time series of (a) TSI (W m−2) and (b) the irradiance in the 200–320 nm spectral band (W m−2) for the RCP8.5_ref (black) and RCP8.5_solmin (blue) cases. The mean percent differences for the period 2050–2099 are shown in the legends.

Time series of (a) TSI (W m−2) and (b) the irradiance in the 200–320 nm spectral band (W m−2) for the RCP8.5_ref (black) and RCP8.5_solmin (blue) cases. The mean percent differences for the period 2050–2099 are shown in the legends.