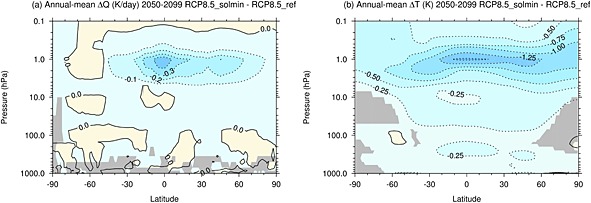
Figure 3.

The difference in (a) annual mean zonal mean shortwave heating rates (K d−1) and (b) annual mean zonal mean temperature ( ) between the RCP8.5_solmin and RCP8.5_ref experiments for the period 2050–2099. Grey shading indicates where the differences are not statistically significant at the 95% confidence level. The contour interval is 0.1 K d−1 and 0.25 K, respectively.
