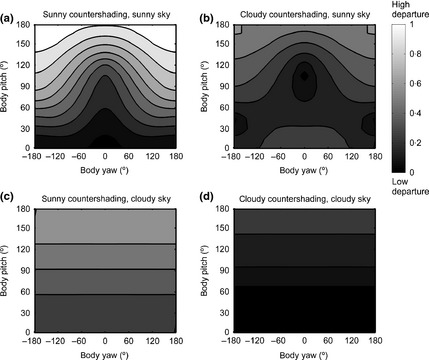
Figure 4.

Deviation from optimal camouflage with change in orientation and/or lighting condition. Time of the day, time of the year, geographical location match those of Fig. 3, top panel. Each row is data from a specific sky (sunny, cloudy), and each column is a particular optimal countershading (for sunny or cloudy conditions). The four departure plots have been normalized jointly to have a global maximum departure of 1.
