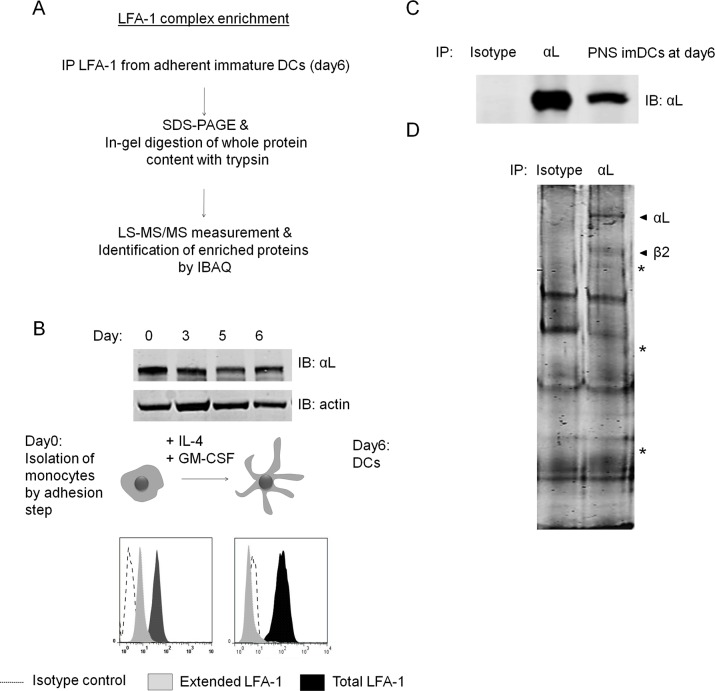
Fig 1. Enrichment and identification of LFA-1 complexes.
(A) Experimental flow chart for enrichment and identification of LFA-1 complexes in imDCs. Adherent imDCs from 3 healthy donors were lysed, followed by enrichment of LFA-1 by IP and separation by SDS-PAGE. The protein content was visualized by colloidal coomassie labeling, excised in one piece and subjected to MS analysis and protein identification. (B) Top: Immunolabeling of LFA-1 in cell lysates of equal amounts of monocytes (day0) and imDCs on day 3,5 and 6 of DC differentiation. Loading control: actin. Bottom: Expression levels of total (TS2/4) and active/extended (NKI-L16) cell surface LFA-1 assessed by flow cytometry. (Isotype control, dotted line; extended LFA-1, grey; total LFA-1, black). (C) Immunolabeling of immunoprecipitated LFA-1 from the post nuclear supernatant (PNS) of day 6 imDCs. (D) Colloidal coomassie staining of SDS-PAGE gels from immunoprecipiated LFA-1 in DCs. LFA-1 was enriched using mAb (clone SPV-L7) directed against αL. mIgG1 coated beads were included as control IP. LFA-1 subunits and potential interaction partners are indicated by arrow heads. Protein bands specifically identified in the LFA-1 IP are indicated by asterisk.

