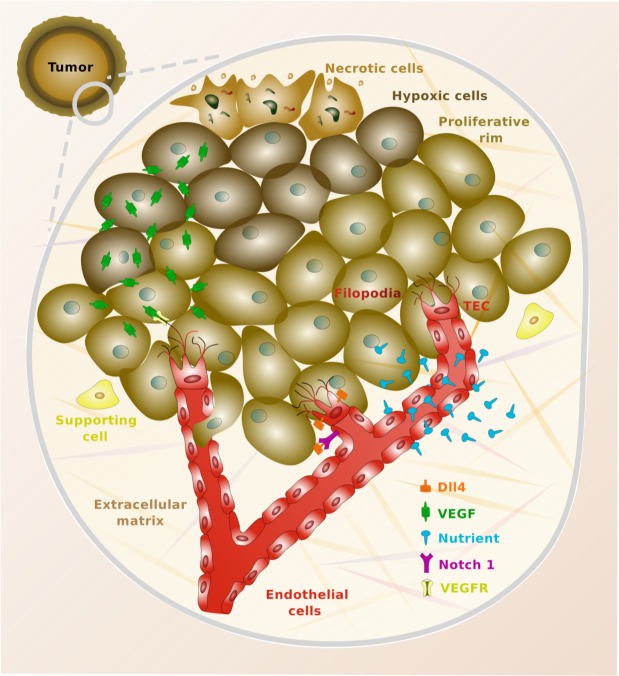
Fig 1. Vascular tumor growth.
The top left part represents a relatively small tumor which is undergoing the vascular switch. The tumor is radially divided into three parts, which represent the proliferative rim (outer ring), the hypoxic zone (mid part), and the necrotic core (inner area). A small area of the tumor is surrounded by a gray solid line whose interior is zoomed in. In the zoomed-in area, we can observe tumoral cells colored with different brown tones, according to their condition of necrotic, hypoxic, or proliferative cells. The red area shows the capillaries, which are lined by endothelial cells as shown in the plot. The new sprouts are led by tip endothelial cells (TECs), which are endowed with filopodia to better explore their surroundings [10, 15]. The picture also shows how the capillaries release nutrients that diffuse throughout the tissue. Similarly, hypoxic cells release vascular endothelial growth factor (VEGF), which eventually binds to surface receptors located in the membrane of endothelial cells (VEGFR). Finally, the figure shows how TECs overexpress the protein Delta-like ligand 4 (Dll4). This protein binds to the Notch receptors of nearby endothelial cells, preventing them from also becoming TECs [12, 13].

