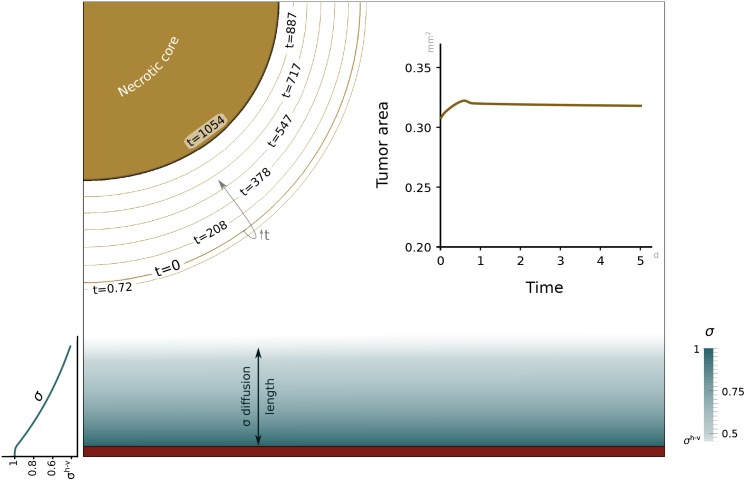
Fig 5. Simulation of avascular tumor growth.
The amount of nutrient (blue scale) released from the capillary at the bottom edge is not enough for tumor cells to proliferate. Thus, the tumor remains at a constant size within usual experimental time scales (tumor area graph) and shrinks at very long time scales (brown contour lines). By day 1054 (solid brown), the tumor radius has been reduced to approximately 67% of its initial value.

