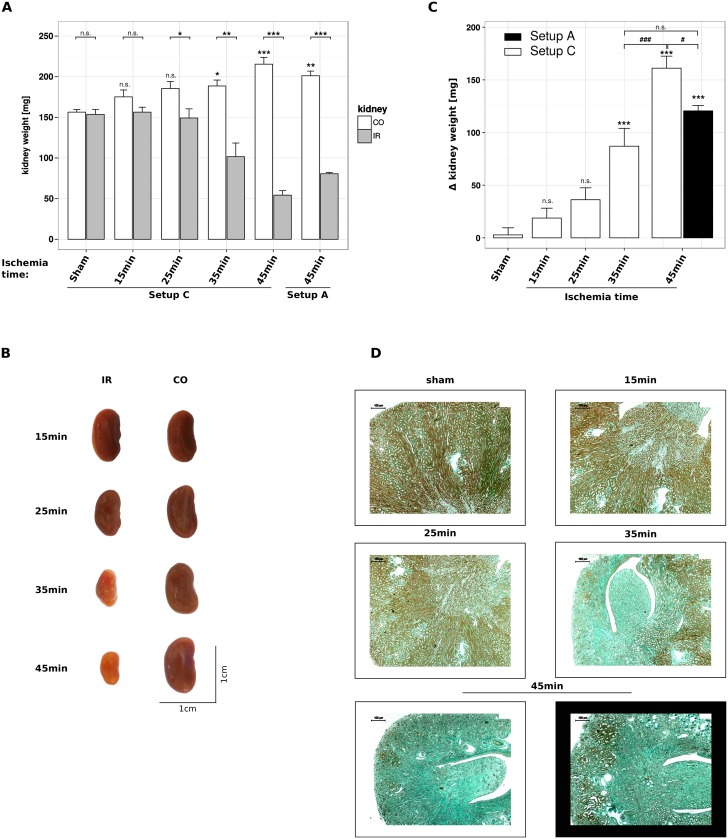
Fig 7. Optimizing temperature control enhances kidney atrophy after IRI.
Male C57BL/6N mice, 6–8 weeks of age, underwent unilateral ischemia for 15, 25, 35 or 45 minutes ischemia and subsequent reperfusion for 5 weeks using setup A and/ or C. (A) Kidney weight [mg] is given as mean ± SEM, asteriks above CO kidneys refer to differences compared to sham-operated mice, derived from n ≥ 5. (B) Images of contra-lateral and ischemic kidneys are taken from mice that underwent IR surgery in setup C. (C) Δ kidney weight [mg] calculated from the data shown in (A) is expressed as mean ± SEM, derived from n ≥ 5. (D) Pictures of Masson’s trichrome stained kidney sections correspond to the data shown in (C).

