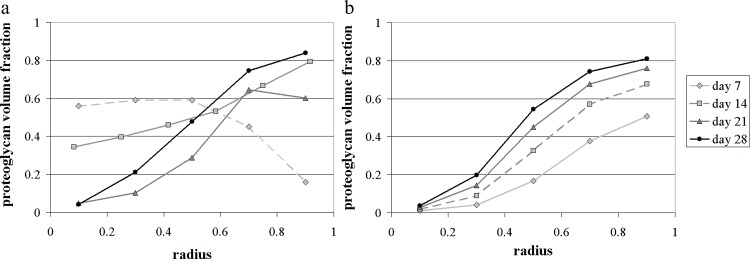
Fig 3.
Proteoglycan volume fraction within pellets cultured for 7, 14, 21 and 28 days: comparison between the experimental data (mean volume fraction over three replicates) (a) and our model predictions (b), with Σ0 = 6, β = 0.23 s-1 and κ = 0.3. In both panels the x-axis corresponds to the non-dimensional radius r / S(t). (a) Experimental data; (b) Model predictions.

