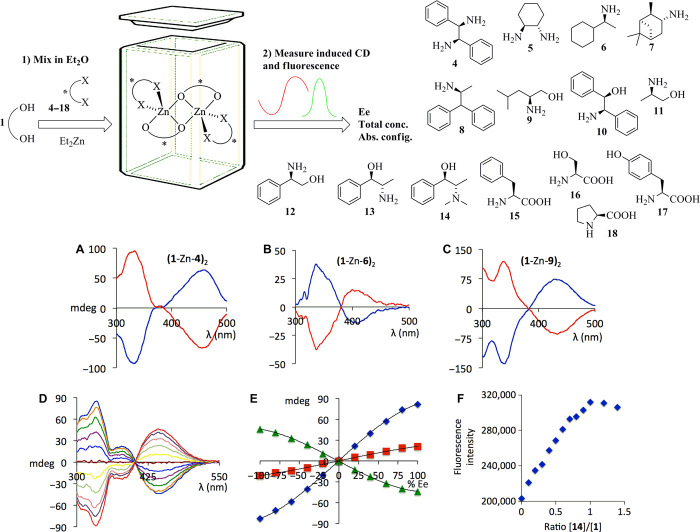
Fig. 1. Chiroptical sensing of amines, amino alcohols, and amino acids.
Top: General CD sensing scheme and substrate scope (only one enantiomer of each substrate is shown) of the zinc complex of 1. Middle: (A) CD spectra of the Zn complex derived from 1 and (1R,2R)-4 (blue) and (1S,2S)-4 (red). (B) CD response to (R)-6 (blue) and (S)-6 (red). (C) CD response to (R)-9 (blue) and (S)-9 (red). Bottom: (D) CD spectra of the Zn complex derived from 1 and nonracemic samples of 14. (E) Plots of the CD amplitudes at 338 nm (blue), 385 nm (red), and 445 nm (green) versus ee. (F) Plot of the fluorescence intensity of the Zn complex derived from 1 and varying equivalents of 14. All CD spectra were collected at 1 mM in diethyl ether.

