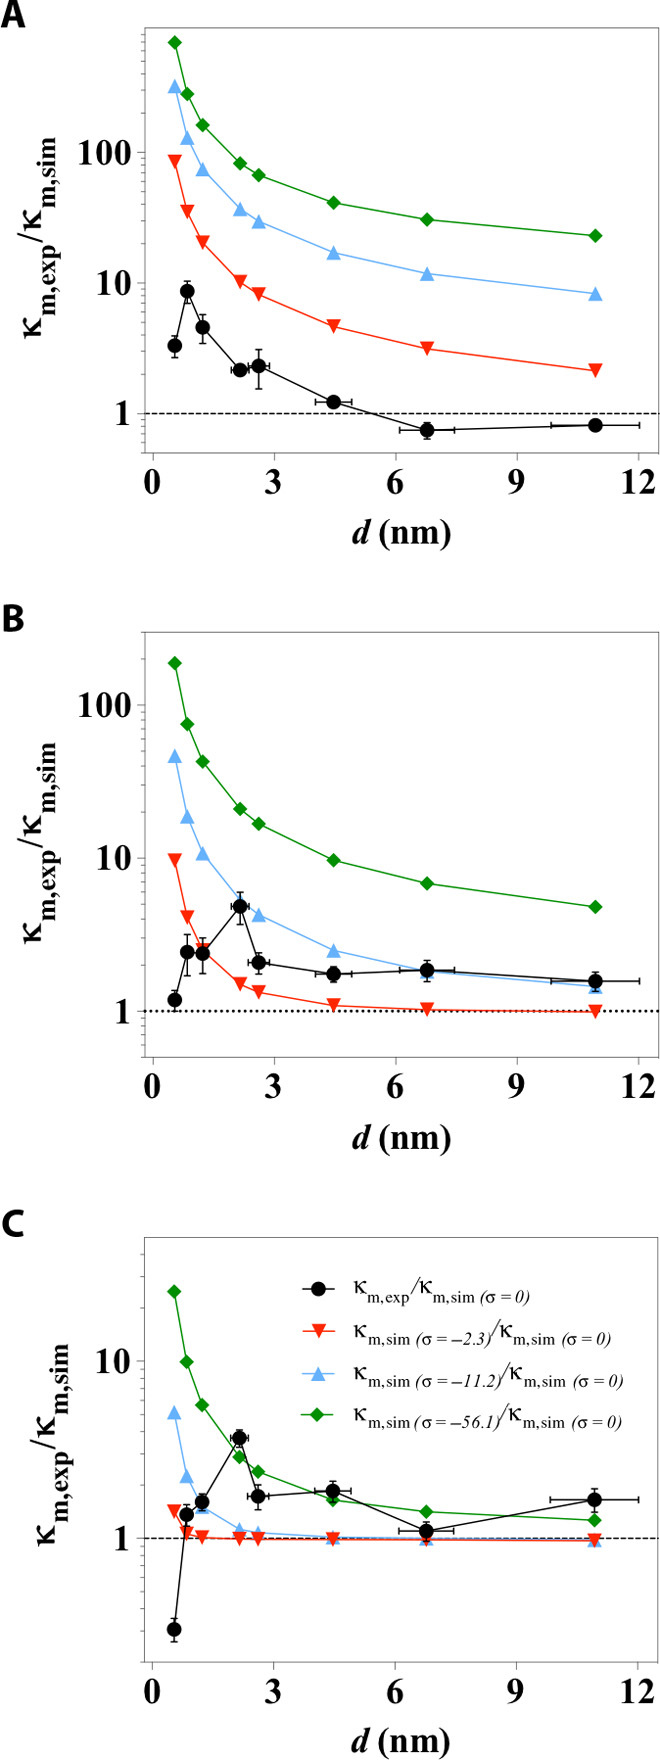
Fig. 5. Scaling behaviors of the electrokinetic ion transport as a function of channel size across the range of sub–10 nm and of varied ionic concentrations.

(A to C) Black symbols show the comparison between experimentally measured and simulated channel conductivity, denoted as κm,exp/κm,sim made in electrolyte concentrations of (A) 1 mM, (B) 10 mM, and (C) 100 mM KCl. κm,sim was calculated with zero surface charge, also denoted as κm,sim (σ = 0) for comparison with the conditions of various surface charge. The colored scatter plots are the theoretical predictions of the scaling behaviors when a surface charge of σ = −2.3 mC/m2 (red triangles), σ = −11.2 mC/m2 (blue triangles), or σ = −56.1 mC/m2 (green diamonds) was imposed in the cascading nanoslits model.
