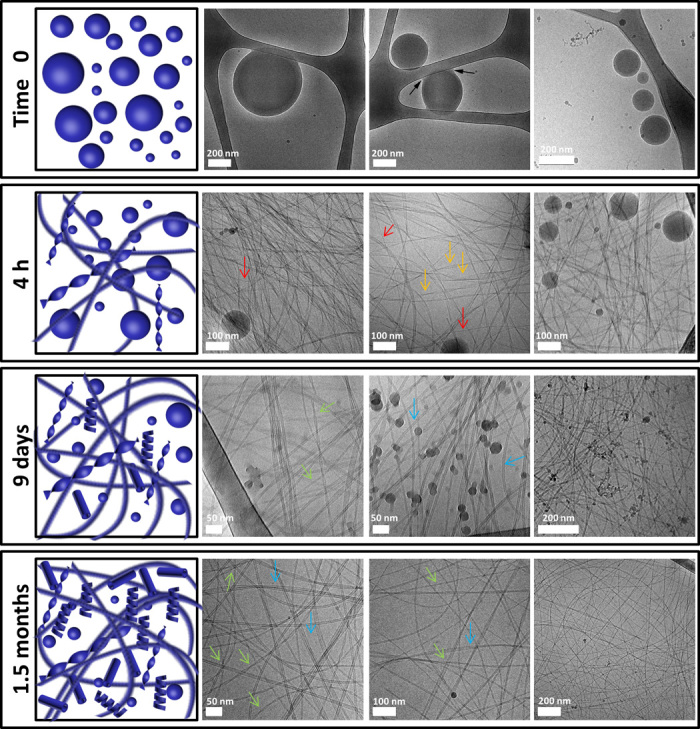
Fig. 2. Cryo-TEM analysis of Fmoc-DOPA assembly.

Samples of Fmoc-DOPA (1 mg/ml) were imaged using cryo-TEM at different time points after the initiation of assembly. Micrographs of time 0 are from samples of a turbid solution. Micrographs of 4 hours and 9 days are from semitransparent gel-like samples. Micrographs of 1.5 months are from a gel containing macroscopically observable crystals. Black arrows point to spheres that adhere to the carbon-coated grid, forming menisci at the point of adhesion. Red arrows point to fibers. Orange arrows point to twisted ribbons. Green arrows point to helical ribbons. Blue arrows point to tubes.
