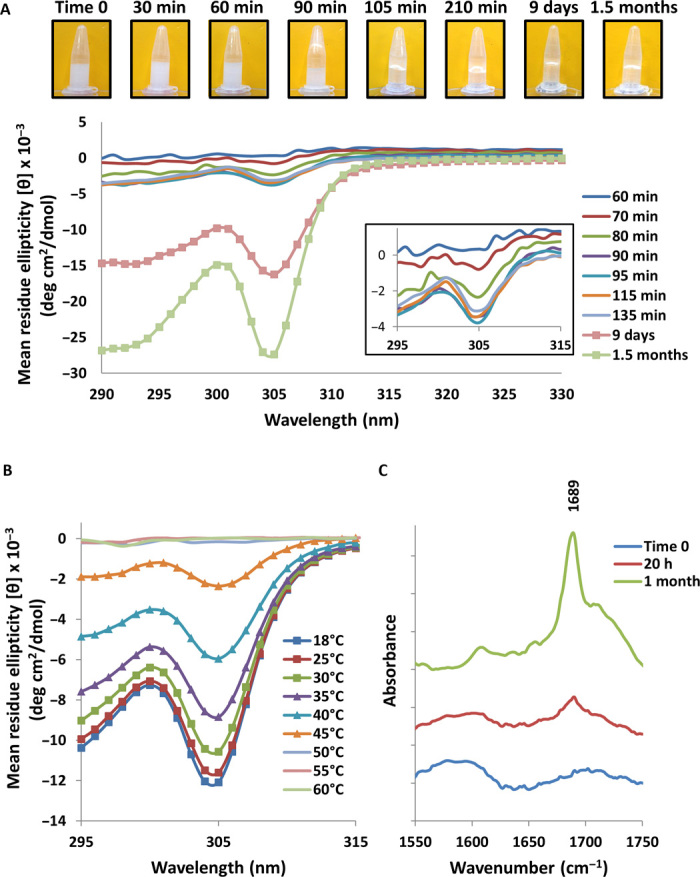
Fig. 3. Spectroscopic investigation of Fmoc-DOPA assembly.

(A) Near-UV time-dependent CD spectra of Fmoc-DOPA (1 mg/ml) and a corresponding macroscopic vial inversion assay. The inset shows a magnification of the CD spectra collected between 295 and 315 nm during the first hours of assembly. (B) Temperature-dependent CD spectra of Fmoc-DOPA (1 mg/ml). (C) Fourier transform infrared (FTIR) spectra of the amide I’ region for Fmoc-DOPA samples (1 mg/ml) taken at different time points. FTIR spectra were normalized and vertically offset for clarity.
