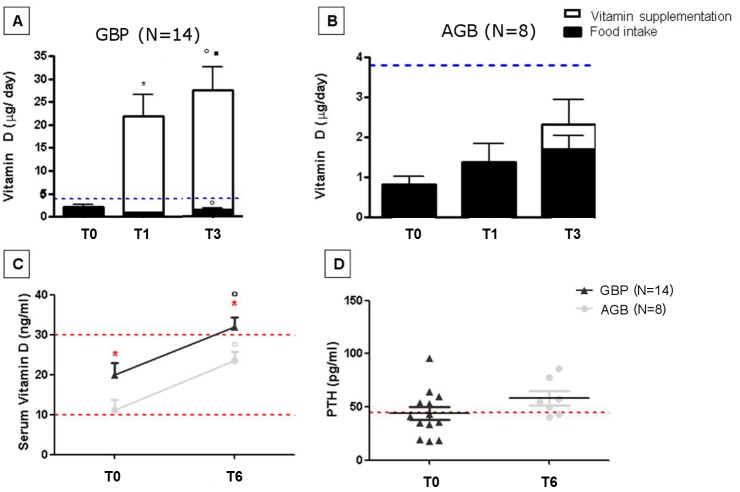
Fig 1. Vitamin D intake and phosphocalcic metabolism in patients undergoing GBP and AGB at baseline and during the follow-up.
Results are expressed as means ± SEMs; significant differences if p<0.05. * represents significant differences between T0 and T1. ■ represents significant differences between T1 and T3.° represents significant differences between T0 and T3. * in red represents significant differences between AGB and GBP. A: Vitamin D food and supplement intake in GBP patients at baseline and during the follow-up. B: Vitamin D food and supplement intake in patients operated from AGB surgery at baseline and during the follow-up (Black bars represent vitamin D intake from food and open bars those from vitamin supplementation given orally. Blue line represents the daily recommended intake). C: Serum vitamin D concentrations at baseline and 6 months after the surgery. Dark grey represents bypass patients and light grey AGB patients (Lower red line represents the value below which vitamin deficiency is defined, the higher line represent the value below which vitamin D insufficiency is defined) D: Parathormone serum concentration at baseline in both groups: dark grey for GBP patients and light grey AGB patients (Red line represents the normal value above which secondary hyperthyroidism is defined).

