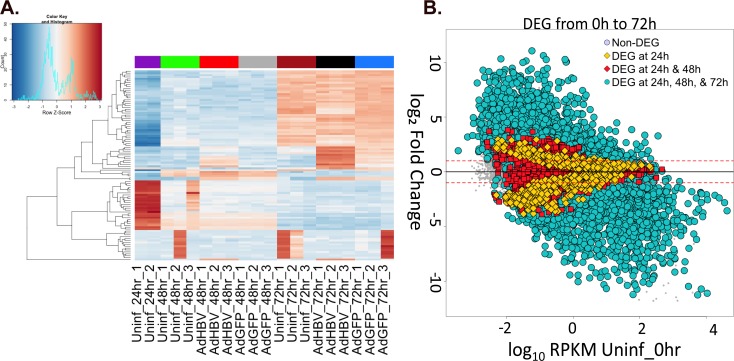
Fig 5. Differential-gene expression due to time in culture.
A. The top 100 most variable genes across all samples were visualized by heatmap. Gene-expression variation was calculated by Z-score, with red indicating an increase in expression compared to the mean across all samples, and blue indicating a decrease in expression. Uninfected 0hr samples were removed from the analysis to prevent a heavy bias due to the large changes within the first 24hr. B. Gene-expression changes in uninfected PRHs over time were plotted as the log10 RPKM value for genes in uninfected 0hr samples versus the log2 fold change compared to uninfected 0hr for genes in the indicated comparison. Yellow diamonds indicate DEG that were only differentially expressed in the first 24hr, red squares represent DEG at 24hr and 48hr but not 72hr, and blue circles represent DEG at 24hr, 48hr, and 72hr.

