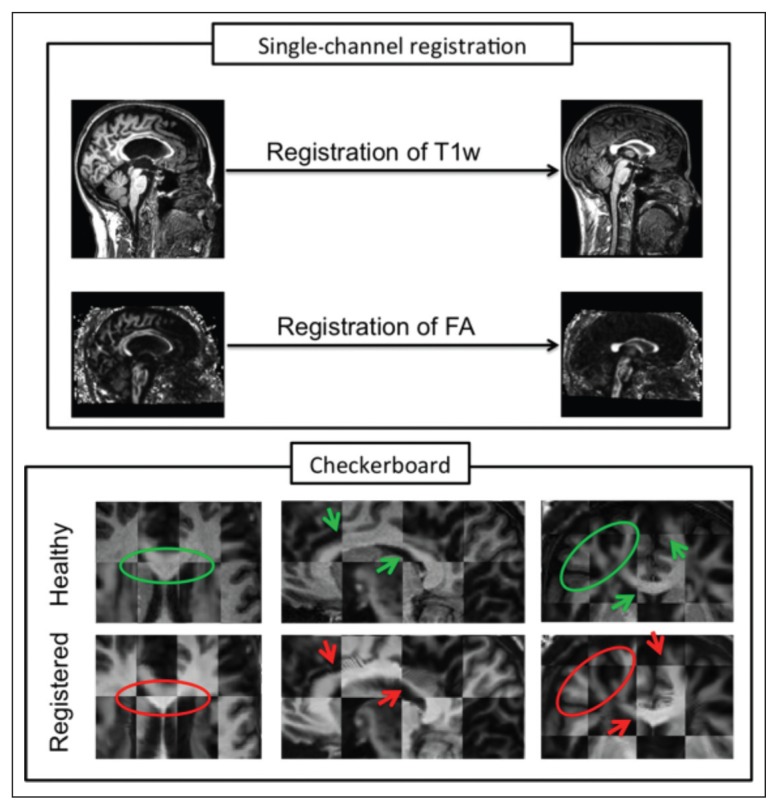
Figure 2.
Misalignment between T1w and FA brain images of an MS patient after registration to a healthy subject.
The box at the top shows the input images (original MS patient on the left and target healthy subject on the right). The box at the bottom shows: the checkerboard between T1w and FA of the original healthy subject (top row) and the checkerboard between the two output images of the single-channel registration (bottom row).

