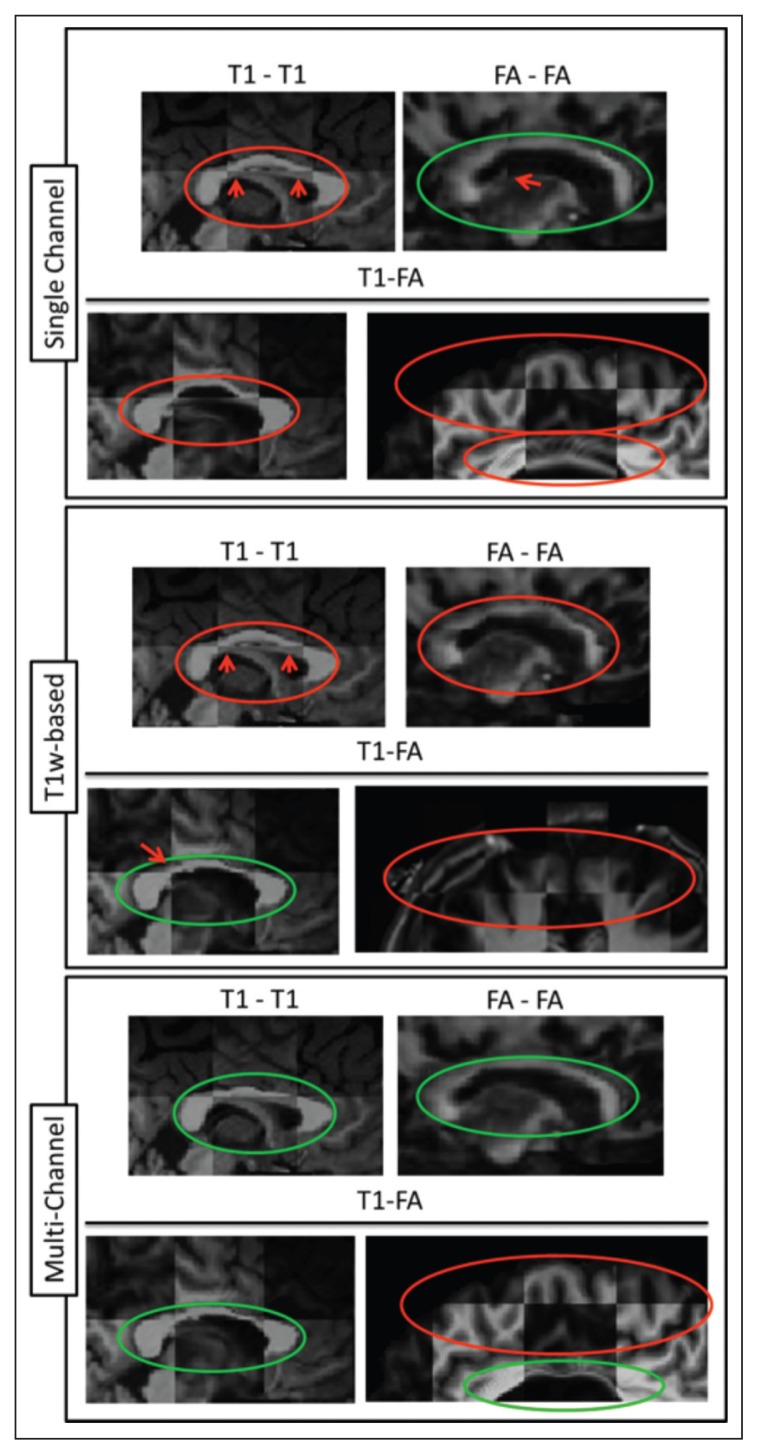
Figure 7.
Checkerboard images of all the combinations for the three strategies (SC, T1w-based and MC).
The top row of each strategy corresponds to T1w-T1w and FA-FA comparisons separately while the second row corresponds to comparison of T1w-FA results. Orange circles show regions of poor registration, whereas green circles show regions of accurate registration.

