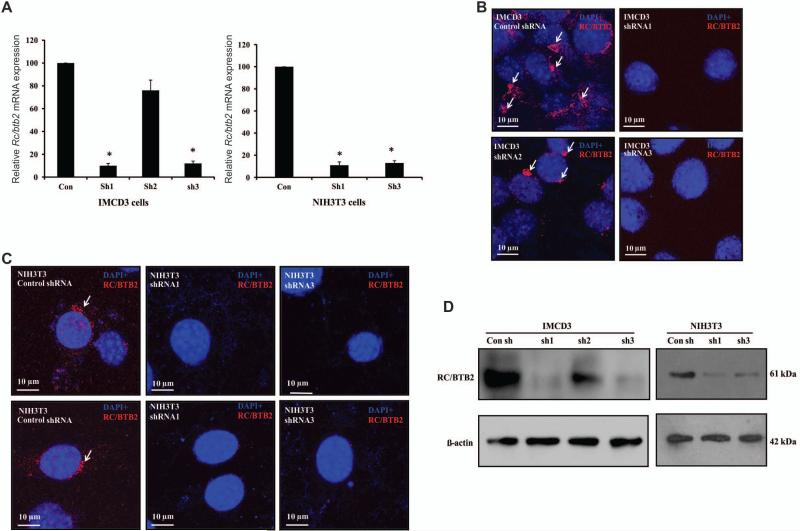
Figure 2. Generation of stable IMCD3 and NIH3T3 cells with low Rc/btb2 expression.
A. Q-PCR analysis of relative Rc/btb2 mRNA expression in stable IMCD3 cells (left panel) and NIH3T3 cells (right panel). Notice that in IMCD3 cells, shRNA1 and shRNA3 reduced Rc/btb2 mRNA expression by about 90%, shRNA2 reduced it by 30%. Like in the IMCD3 cells, expression of Rc/btb2 mRNA in shRNA1 and shRNA3 stable NIH3T3 cells was also significantly lower than the control stable NIH3T3 cells. * p<0.05. B. Immunofluorescence staining of RC/BTB2 in stable IMCD3 cells. Notice that RC/BTB2 is expressed in the control and shRNA2 stable cells (arrows), but not in the shRNA1 and shRNA3 stable cells. C. Immunofluorescence staining of RC/BTB2 in stable NIH3T3 cells. Like in the IMCD3 cells, RC/BTB2 is expressed in the control stable cells, but not in the shRNA1 and shRNA3 stable cells. D. Analysis of endogenous RC/BTB2 protein expression in the stable IMCD3 and NIH3T3 cells. Notice that the 61 kDa RC/BTB2 protein was expressed in the control and shRNA2 cells. However, its expression was dramatically reduced in the shRNA1 and shRNA3 cells.

