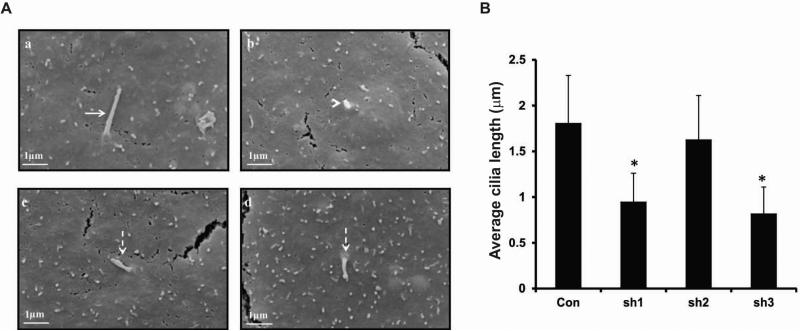
Figure 5. Analysis of ciliogenesis in stable cell lines with different Rc/btb2 mRNA expression levels by scanning electronic microscopy.
A. Representative images of stable control shRNA IMCD3 cells (a) and shRNA1 IMCD3 cells (b-d). High magnification images showed that each control cell had one normal appearing cilium (arrow in a). However, some cells with low Rc/btb2 mRNA (shRNA1 stable cells) expression levels had only small protrusions on the cell surface (arrow head in b). When cilia were formed, most appeared to be shorter than cilia on the control cells (dashed arrows in c, d).
B. Average length of cilia formed in the stable IMCD3 cells. Three independent experiments were conducted. For each stable cell line, twenty cilia were randomly selected and cilia length was measured, and statistical differences were calculated. * p<0.05.

