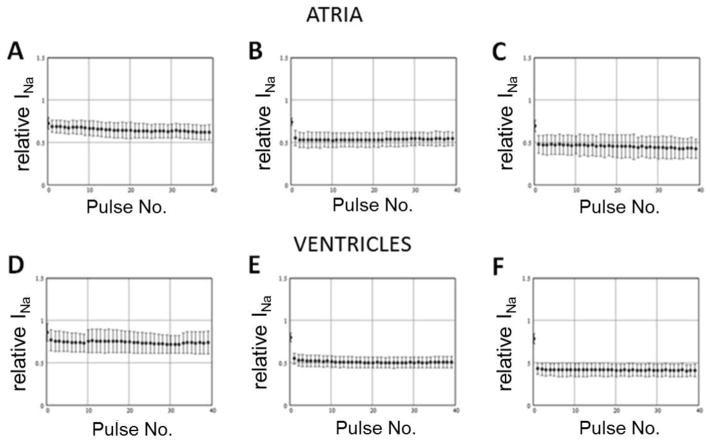
Figure 2.
Decrease of the peak sodium channel current (INa) during the train of 200 ms pulses delivered from −80 mV to −30 mV in the presence of 10 g/L Wenxin Keli and normalized to peak INa recorded during the same train in control conditions. Data obtained in atrial cells (top panels; n=4) and in ventricular cells (bottom panels; n=5) using interpulse intervals of 150 ms (A and D), 50 ms (B and E), and 20 ms (C and F).

