
Figure 1.
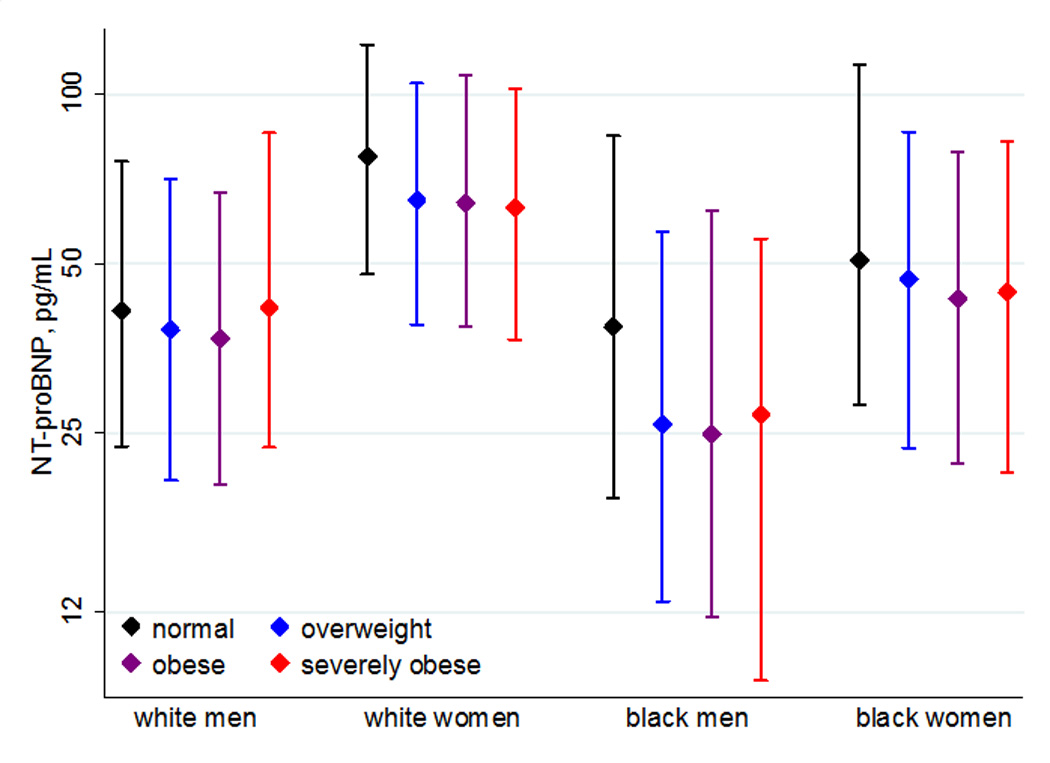
Median NT-proBNP levels within BMI Categories, Stratified by Race/Gender Subgroups. The median NT-proBNP levels and associated interquartile ranges within each BMI category are displayed for white men, white women, black men and black women.