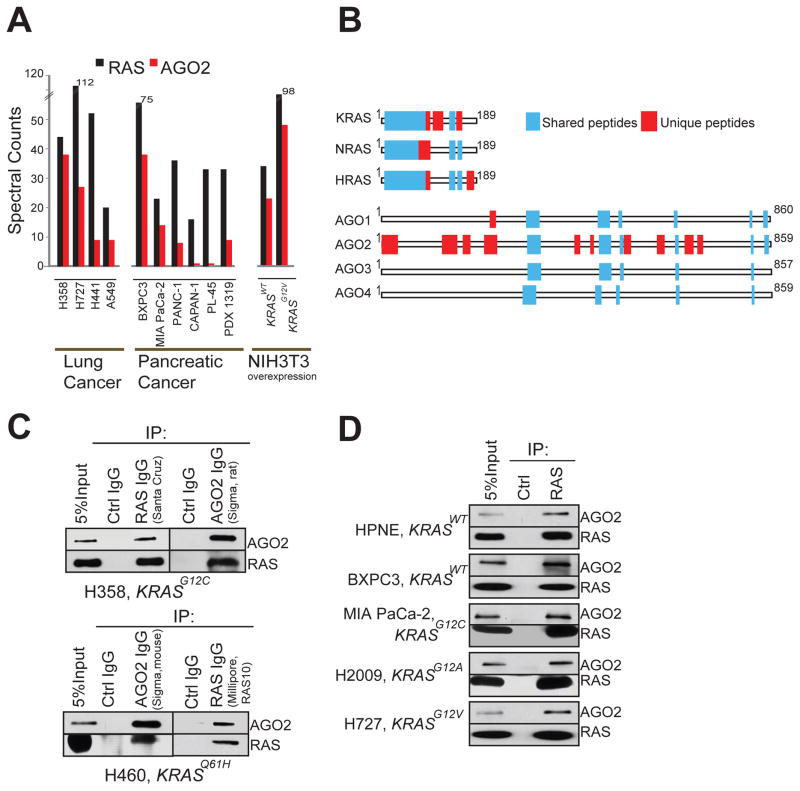
Figure 1. Identification of the RAS-AGO2 interaction.
Spectral counts of RAS and AGO2 peptides detected in RAS co-immunoprecipitation mass spectrometric (co-IP MS) analysis of NIH3T3 cells expressing KRASWT and KRASG12V (A) and indicated cancer cell lines (B). (C) Distribution of peptides mapping to RAS and AGO gene families from RAS co-IP MS based on ClustalW alignments. Representative experiment from H358 cells is shown. Blue boxes indicate peptides mapping to multiple gene family members, and red boxes indicate peptides mapping uniquely to a protein. (D) Immunoprecipitation (IP) of RAS or AGO2 in H358 (left) and H460 (right) lung cancer cells followed by immunoblot analysis using multiple distinct antibodies, as indicated. (E) IP of RAS from a panel of benign and cancer cells with differing mutational status of KRAS (as indicated) followed by immunoblot analysis of AGO2 or RAS. RAS10 mAb was used for both IP and IB. See also Figure S1.

