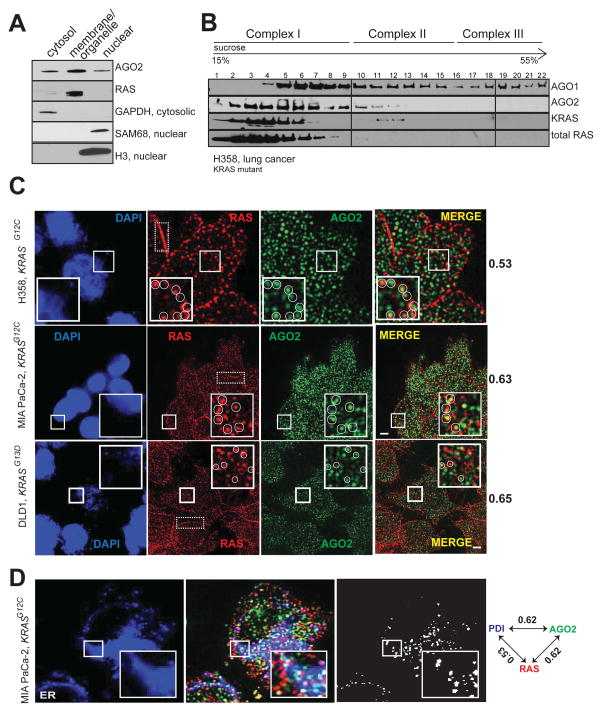
Figure 2. Co-sedimentation and co-localization of RAS and AGO2 in the endoplasmic reticulum.
(A) Cell fractionation analysis of H358 cells to show enrichment of distinct proteins in the cytosolic/membrane or organelle/nuclear fractions. GAPDH was used as a cytosolic marker while SAM68 and H3 histone were used as nuclear markers. (B) Sucrose density gradient fractionation of cell lysates from H358 cells followed by immunoblot detection of total RAS, KRAS, AGO1 and AGO2 proteins. (C) Representative images of immunofluorescence analysis of RAS (red) and AGO2 (green) in H358, MIA PaCa-2 and DLD-1 cells. Yellow spots in merged images indicate perinuclear co-localization of RAS and AGO2. The nucleus was visualized by DAPI staining (blue). Dotted boxes highlight plasma membrane regions predominantly localized by RAS. Manders overlap coefficient, in the intracellular regions of the cells are indicated on the right. An overlap coefficient of 0 suggests no co-localization, whereas a value of 1 indicates complete co-localization. The inset shows a magnified 5.3 μm x 5.3 μm view of the areas marked. Images are pseudocolored maximum intensity projections (across 2.5 μm), obtained from 3D imaging. Scale bar, 5 μm. (D) Representative images of immunofluorescence analysis of AGO2 (green), RAS (red) and ER marker, PDI, (blue) in MiaPaCa-2 cells. White spots indicate co-localization signals for RAS/AGO2/PDI in each panel. Pairwise Manders overlap coefficients are shown on the right. The inset shows a magnified 6.7 μm x 6.7 μm view of the areas marked. Scale bar, 5 μm. See also Figure S2.

