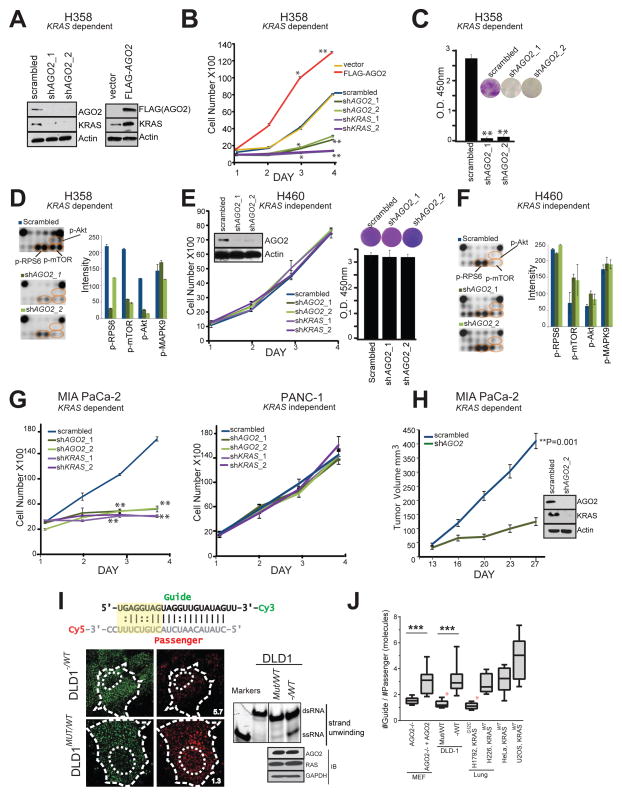
Figure 5. AGO2 is essential for mutant KRAS dependent cell proliferation.
(A) Immunoblot analysis of AGO2 and KRAS after knockdown or overexpression of AGO2. (B) Growth curves and (C) colony formation assays of mutant KRAS dependent H358 lung cancer cells, following either knockdown of KRAS/AGO2 using shRNA or AGO2 overexpression. Error bars are based on standard error of the mean. *(P<0.05) and **(P<0.005) denote significant differences in growth at the indicated times compared to either scrambled or vector control. Data were obtained from three independent experiments. (D) Pathscan intracellular signaling arrays probed with lysates from H358 cells following AGO2 knockdown. (E) Growth curves (left) and colony formation assays (right) of mutant KRAS independent H460 lung cancer cells, following knockdown of KRAS/AGO2. Data obtained from three independent experiments are shown. Inset, immunoblot analysis of AGO2 and KRAS upon AGO2 knockdown. (F) Intracellular signaling array probed with lysates from H460 following AGO2 knockdown. (G) Growth curves of pancreatic cancer cells, MIA PaCa-2 (mutant KRAS dependent) (left) and PANC-1 (mutant KRAS independent) (right) following knockdown of KRAS or AGO2, as indicated. *(P<0.05) and **(P<0.005) denote significant differences in growth at the indicated times compared to scrambled control. Data were obtained from three independent experiments. (H) In vivo growth of Mia PaCa-2 cells transiently treated with either scrambled shRNA or shRNA targeting AGO2 prior to injecting in nude mice. For each group (n=8), one million cells were injected and average tumor volume (in mm3) was plotted on y-axis and days after injection on the x-axis. Right, immunoblot analysis of AGO2 and RAS following AGO2 knockdown in Mia PaCa-2 cells. Indicated P-value was calculated using two sided student t-test for the two groups. (I) Top, Schematic of the labeled let-7 microRNA used in the intracellular strand unwinding assays. Straight lines and double dots represent, Watson-Crick and Wobble pairs respectively. The thermodynamically unstable end (highlighted in yellow), promotes asymmetric loading of the guide strand. Bottom left, representative images of the guide strand (green) and passenger strand (red) of let-7 microRNA, 30 minutes post intracellular injections in DLD-1 isogenic lines, expressing wild type KRAS (− / WT) or KRASG12C (MUT / WT). Numbers represent the Guide: Passenger strand ratio. Ratio of 1:1 indicates attenuation of let-7 dsRNA unwinding while a higher guide:passenger strand ratio indicates efficient unwinding and functional RISC. Scale bar, 10 μm. Bottom right, native acrylamide gel electrophoresis of let-7 unwinding assay and immunoblot analysis of DLD-1 isogenic cell line extracts. M1 and M2 represent double (ds) and single stranded (ss) markers respectively. (J) Box plot representing the Guide: Passenger strand ratio in the indicated cell lines with varying KRAS mutation status. Whiskers represent minimum and maximum values and line represents median of the data set (n ≥ 2, # cells ≥ 13, ***p < 0.0005). Red asterisk indicates cells expressing mutant KRAS. See also Figure S5.

