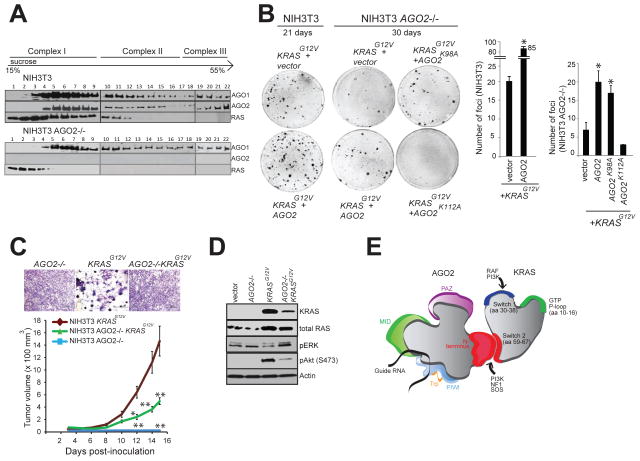
Figure 7. AGO2 interaction is required for maximal oncogenic potential of mutant KRAS.
(A) Sucrose density gradient fractionation of parental NIH3T3, NIH3T3 KRASG12V and NIH3T3 AGO2−/− cell lysates followed by immunoblot detection of RAS, AGO1 and AGO2 proteins. (B) Left, representative images of KRASG12V driven foci in NIH3T3 and NIH3T3 AGO2−/− cells upon co-transfection with various AGO2 constructs. Right, quantitation of foci from two replicate experiments. Error bars show standard error of mean and asterisks indicate P values less than 0.005 for the indicated conditions compared to vector control. (C) Upper panel, shows crystal violet staining of indicated stable lines grown in 10% serum. Lower panel, in vivo growth of NIH3T3 or NIH3T3 AGO2−/− cells stably expressing KRASG12V in nude mice. For each group (n=8), 500,000 cells were injected and average tumor volume (in mm3) was plotted on y-axis and days after injection on the x-axis. Error bars are standard error of mean * P<0.05 and ** P<0.005 at the indicated times. (D) Immunoblot analysis showing reduced expression of oncogenic KRAS in KRAS AGO2−/− stably expressing KRASG12V and the extent of phospho-ERK and phospho-AKT activation in these cells. (E) Schematic representation of the N-terminal domain of AGO2 interacting with the switch II domain in RAS. See also Figure S7.

