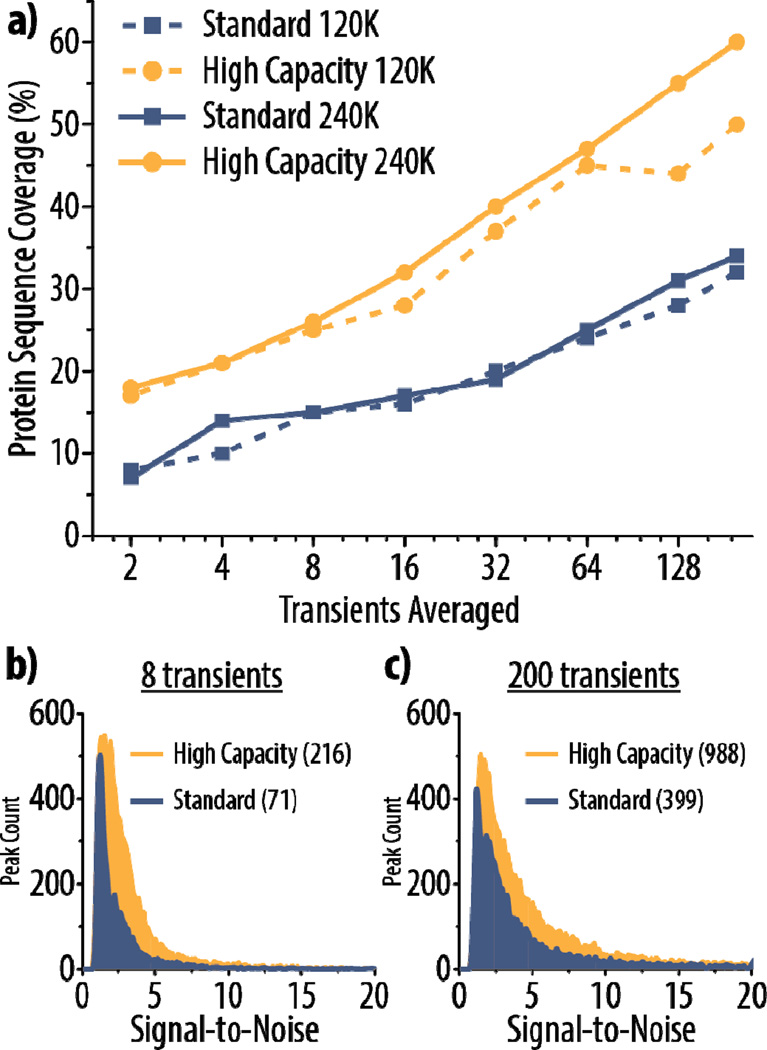
Figure 6. High capacity ETD provides superior results for characterization of carbonic anhydrase (~29 kDa).
Protein sequence coverage for the z = +34 precursor of carbonic anhydrase using either high capacity or standard ETD is shown in (a) with varying degrees of spectral averaging and at two different resolving powers (120K and 240K). Histograms display the distribution of signal-to-noise (S/N) of peaks in high capacity and standard ETD spectra using 8 or 200 averaged transients (b and c, respectively) at a resolving power of 240K. The y-axes show the peak count for a given S/N value (bin size = 0.1). The maximum S/N for a peak in each spectrum is given in parentheses in the figure, although the histograms only display the distributions up to 20 S/N to highlight the region where the majority of the peaks lie.

