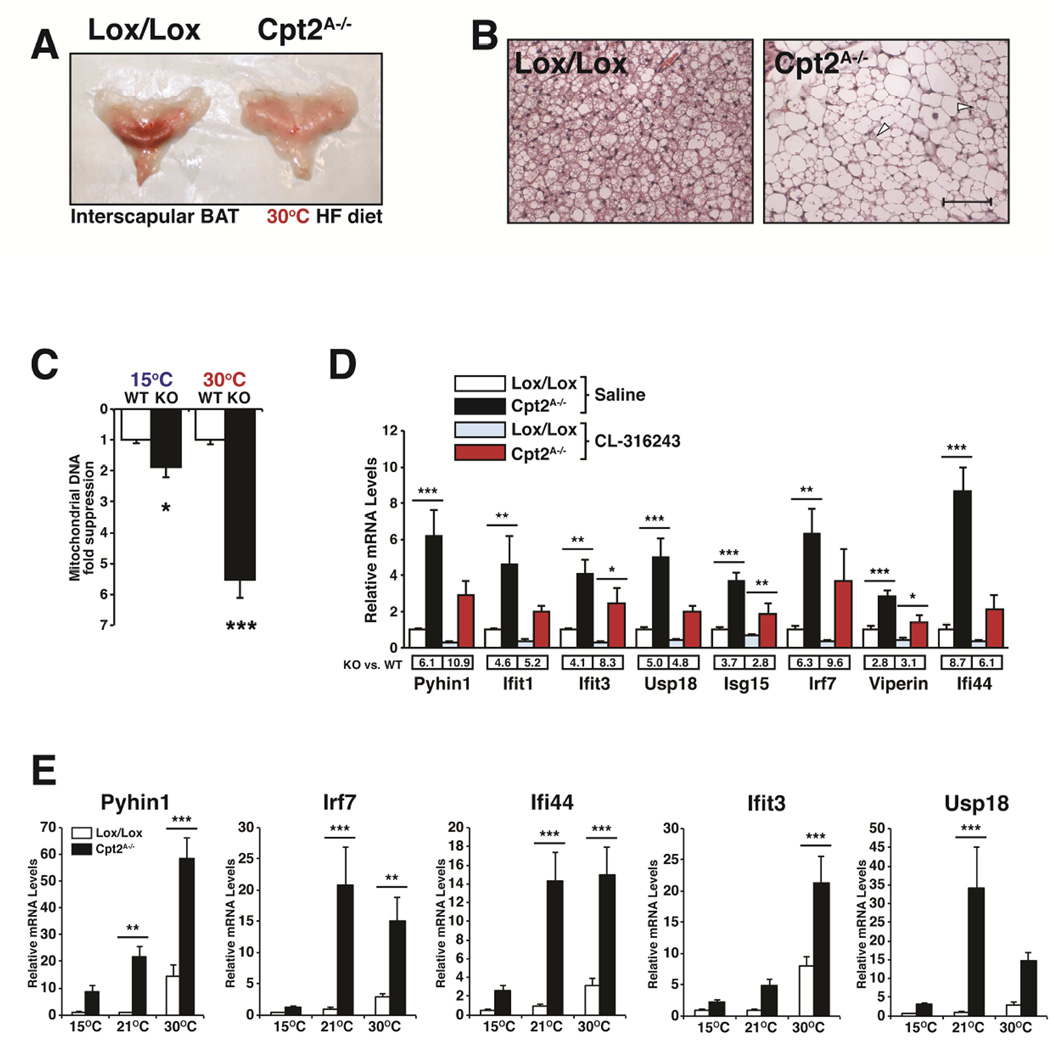
Figure 3. Loss of fatty acid oxidation potentiates mitochondrial DNA stress.
(A) Gross interscapular BAT morphology of control and Cpt2A−/− mice after 12 wks of HFDat thermoneutrality.
(B) Hematoxylin and Eosin (H&E) stained BAT from control and Cpt2A−/− mice after 12 wksof HFD at thermoneutrality. Arrows indicate BAT morphology. Scale bar is 100 μM.
(C) Mitochondrial DNA fold suppression of control and Cpt2A−/− BAT at 15°C and 30°C (n=5).
(D) mRNA expression in BAT of interferon stimulated genes in BAT of control and Cpt2A−/− mice injected with vehicle or CL-316243 at thermoneutrality (n=5).
(E) mRNA expression in BAT of interferon stimulated genes in control and Cpt2A−/− mice after 2wks at 15°C, 22°C and 30°C (n=5).
Data are expressed as mean ± SEM. *p<0.05; **p<0.01; ***p<0.001.

