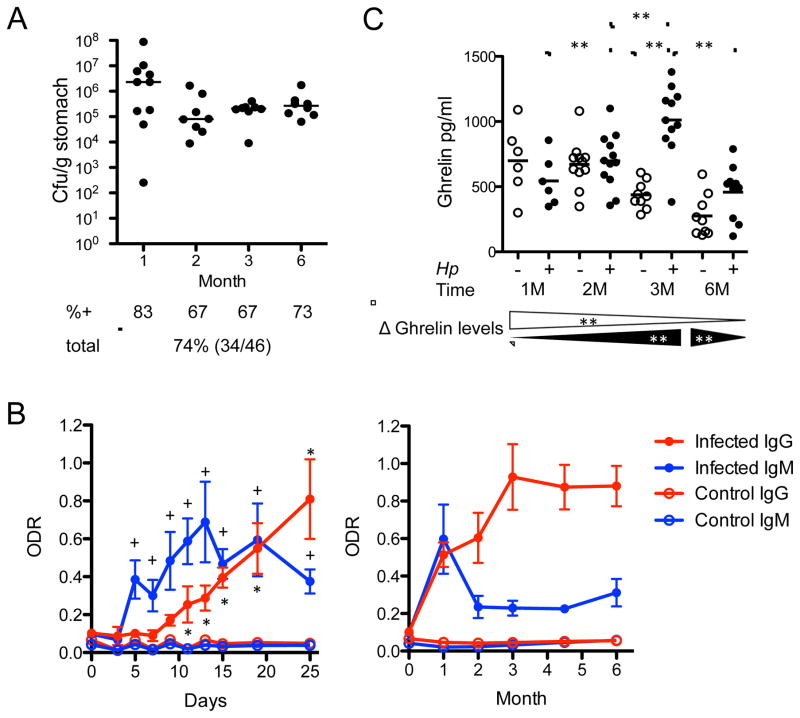
Figure 1. Bacterial colonization, and host antibody and ghrelin responses of C57Bl/6 mice infected with H. pylori strain PMSS1.
(A) Colony-forming units (Cfu) per gram stomach in animals sacrificed at the indicated times post-infection. Bars indicate the medians; %+ indicates percent of mice positive for H. pylori, as determined by culture for each time point of sacrifice; total percentage and number of (positive/total number) of mice is shown in bottom line; (B) Antibody responses. Early (first 25 days following challenge) and long term (over 6 months) anti-H. pylori IgM and IgG responses of control and infected mice expressed in optical density ratios (ODR). (+) or (*) indicates when IgM or IgG levels, respectively, were significantly higher compared to baseline; Mann-Whitney U-Test, +,*p<0.05; (C) Ghrelin responses. Levels of total plasma ghrelin measured over the 6-month challenge (horizontal bars represent mean values). Bottom strip: Δ Ghrelin, changes of ghrelin over time for controls (open triangles) and infected mice (black triangles); Kruskal-Wallace followed by Mann-Whitney U-Test, **p<0.001. See also Figure S1.

