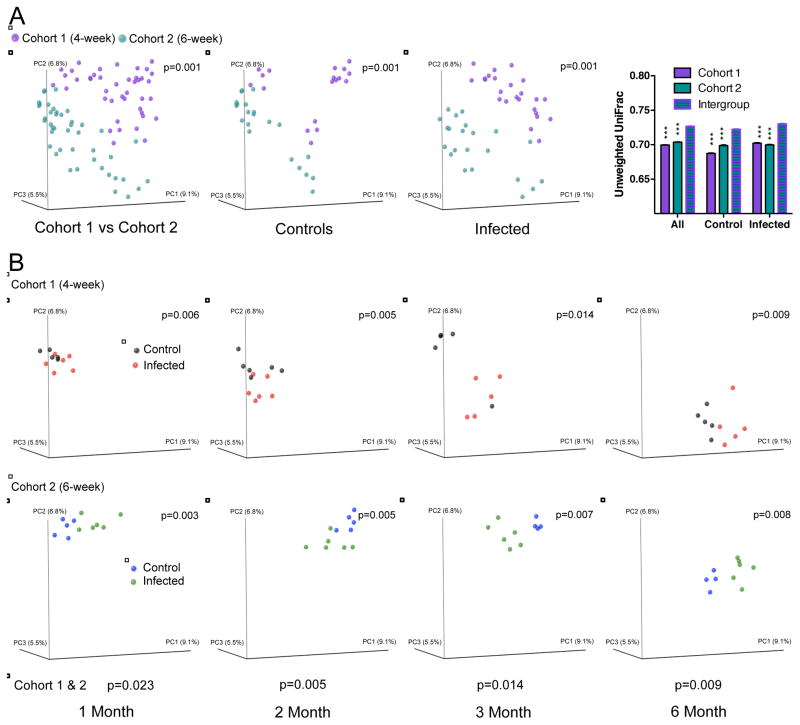
Figure 5. The effect of H. pylori colonization on gastric microbial community structure.
Principal coordinates analysis (PCoA) of the unweighted UniFrac distances computed from 16S rRNA sequences from gastric samples at an even sampling (500) depth. (A) Comparison of Cohort 1 (infected at 4-weeks) and Cohort 2 (infected at 6 weeks); combined, and separated by control or infected status, respectively. Right panel shows average unweighted UniFrac distances (+/− SEM) comparing intragroup variation for the early or late cohort to the intergroup variation (early vs late), for all mice, control mice, and infected mice. ***indicates that intragroup distance is significantly different from the intergroup distance, p<0.005, t-test. (B) Cohort 1 and Cohort 2, viewed separately, over time (month 1, 2, 3 and 6). Each gastric sample is represented as a colored circle; p-values (ADONIS test) are based on unweighted UniFrac distances Significance: p-values < 0.05. See also Figure S6 and Table S5.

