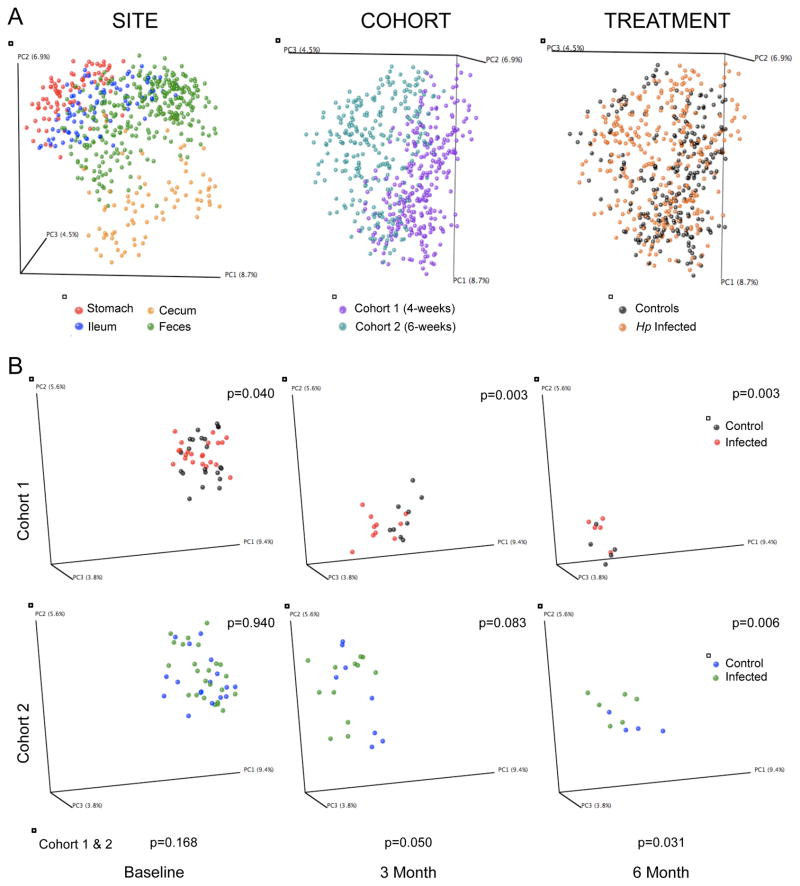
Figure 6. The effect of H. pylori colonization on gastro-intestinal microbial community structures.
Principal coordinates analysis (PCoA) of the unweighted UniFrac distances computed from 16S rRNA sequences at even sampling depth. (A) All samples grouped for site, age at H. pylori challenge (cohort), or treatment status and (B) fecal samples over time (baseline, month 3 and 6) of Cohort 1 and Cohort 2, respectively. Plots are organized as in the legend to Figure 5. See also Figure S6 and Table S5.

