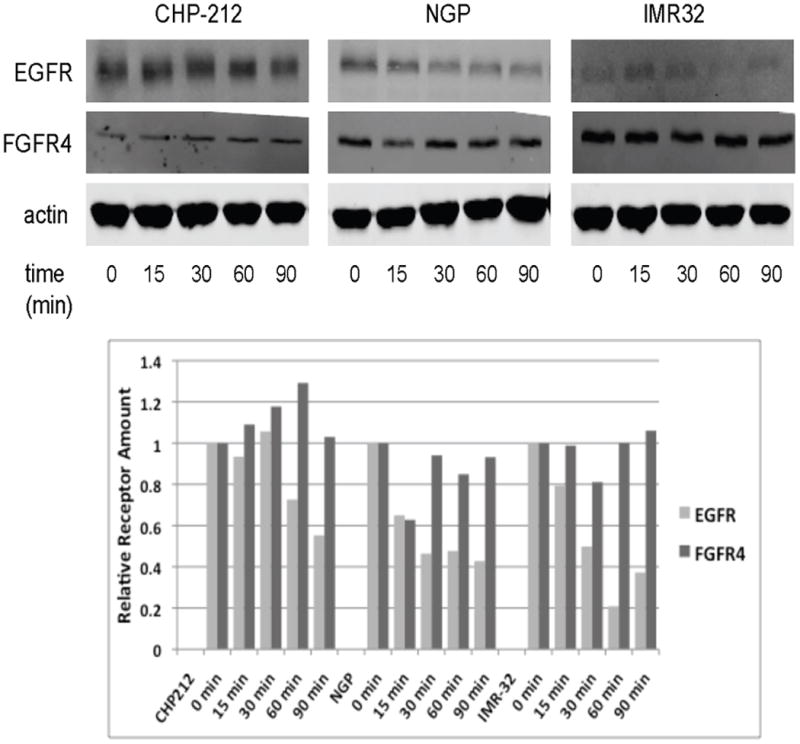
Figure 1. EGFR and FGFR4 degradation after ligand exposure.

Top: Neuroblastoma cell lines were starved and then stimulated with either EGF (left) or basic FGF (right) for indicated times. Cell lysates were examined by immunoblotting for total EGFR (left) and FGFR4 (right) levels. β-actin was used as a protein loading control. Bottom: Band densities from the immunoblots were determined and calculated as a percentage of the total at time 0. The percentage of remaining EGFR and FGFR4 is plotted at each time point.
