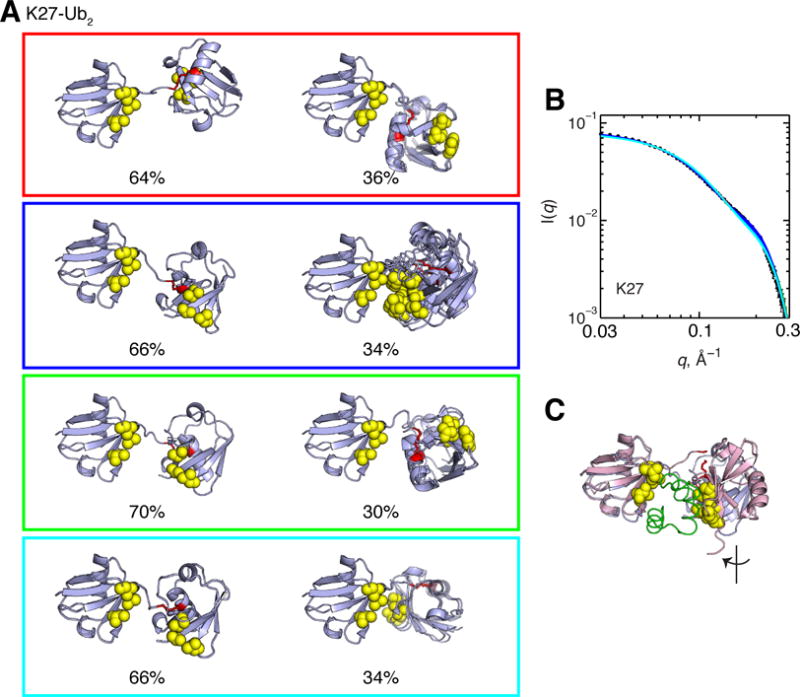
Figure 10.

(A) Two-conformer ensembles for K27-Ub2. Numbers below the structures indicate the population weight of each conformer in the ensemble. Structure rendering throughout this figure is as described in Figure 1, and the isopeptide-linked K27 is shown in red sticks. (B) Agreement between experimental (black circles) and predicted SANS I(q) profiles from the conformational ensembles shown in panel A. Experimental data shown are in the presence of 150 mM NaCl. The I(q) curve for each ensemble is color-coded according to panel A. In panel (C), the major conformer (light blue) from the green ensemble in panel A is superimposed with the solution structure of K48-Ub2 bound to UBA2.65
